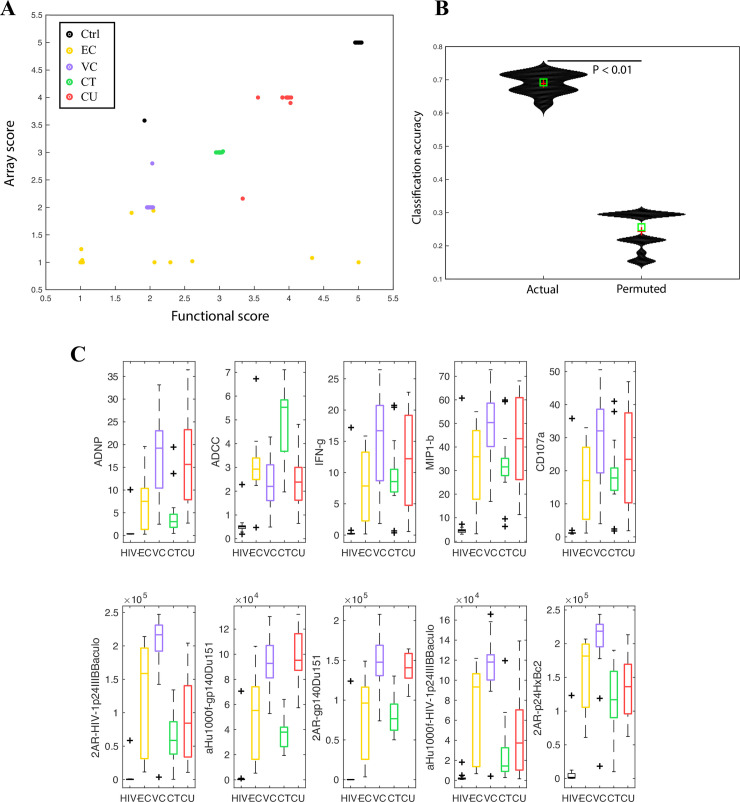
Fig 1. Humoral response profiles can accurately distinguish clinical phenotypes.
A. Bi-plot showing how a classifier built on functional (Fc effector function) and array/biophysical data can discriminate between subjects across 5 different HIV clinical phenotypes. The scores on each axis are obtained from a corresponding random forest model. The X axis scores are from a random forest model built on functional data, the Y axis scores are from a random forest model built on array/biophysical data. B. Violin plots showing classification accuracy of the random forest model from 1A on real and permuted data, as measured in a 5-fold cross validation framework (i.e., with data from some subjects blinded/held out as described in the Methods). Exact P value calculated using a permutation test (P < 0.01) confirms significance of model. C. Boxplots illustrating distributions of the humoral responses that are most predictive/discriminative across the 5 clinical phenotypes.

