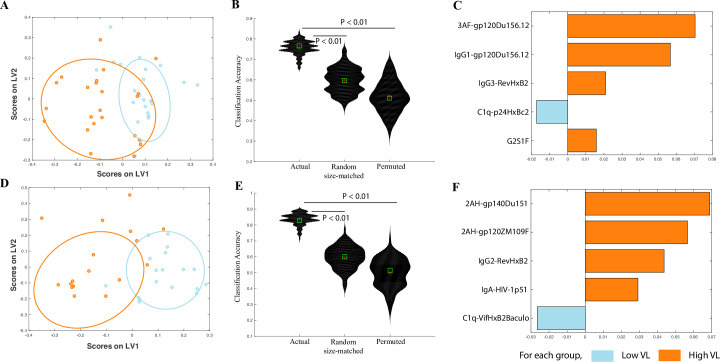
Fig 2. Correlates of viral load in controllers and chronic progressors.
A. A LASSO-based model is used to classify controllers and progressors by viral load. The LASSO-selected features are visualized in 2 dimensions using a partial least squares discriminant analysis (PLSDA) latent variable (LV) scores biplot. B. Violin plots showing classification accuracy of the actual model from (a) and of 2 negative control models (based on randomly selected features & permuted data), as measured in a 5-fold cross validation framework. Exact P values (actual vs permuted and actual vs random-size matched) confirm significance of the model. C. PLS variable importance in the projection (VIP) plot corresponding to the features in (a) used to classify subjects by viral load. D. A LASSO-based model is used to classify only controllers by viral load. The LASSO-selected features are visualized in 2 dimensions using a PLSDA LV scores biplot. E. Violin plots showing classification accuracy of the actual model from (d) and of 2 negative control models (based on randomly selected features & permuted data), as measured in a 5-fold cross validation framework. Exact P values (actual vs permuted and actual vs random-size matched) confirm significance of the model. F. PLS VIP plot corresponding to the features in (d) used to classify subjects by viral load.

