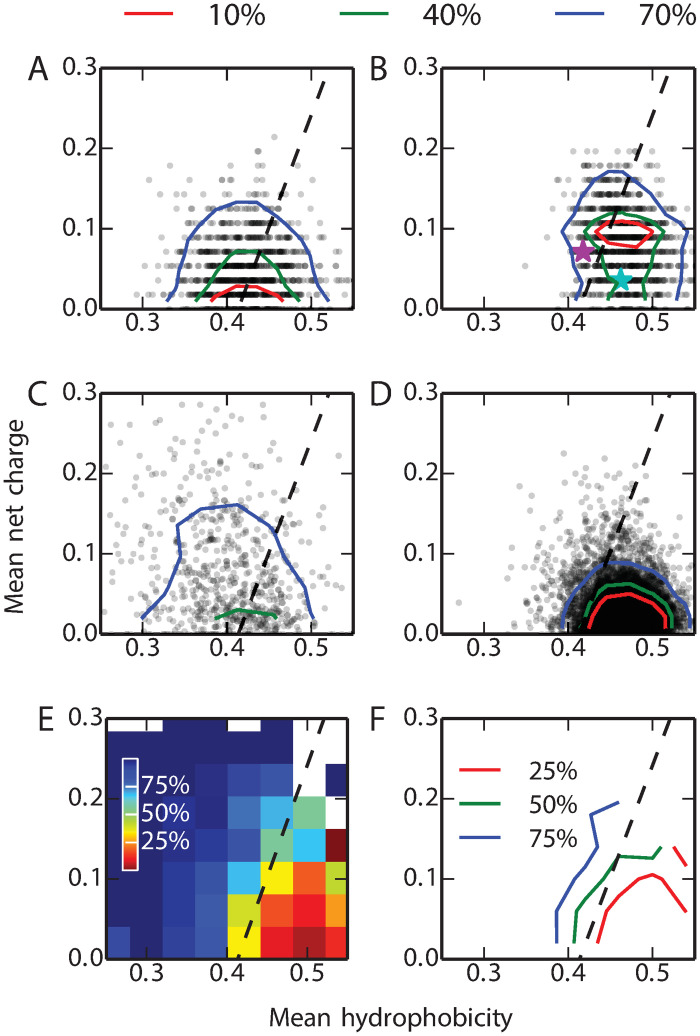
Fig 5. The Uversky plot divides proteins into folded globular and intrinsically disordered proteins based on their mean net change (q) and the mean hydrophobicity (h) [80].
In each plot, the dashed line represents the boundary between the two subsets described by Uversky [80]. We calculated the q, h of 10000 randomly selected transition sequences, defined as having ϕA within [0.49,0.51], from the simulations (A) without and (B) with stability constraints (one symbol for each sequence; probability density contours containing 10, 40 and 70% of the data are also shown). The q, h of 694 known IDPs from the DisProt database [81] and 7957 globular proteins from the Top8000 database [82] are shown in (C) and (D) respectively. Sequences of GA and GB wild-type are shown with cyan and purple stars, respectively, in (B). (E) and (F) are respectively heat map and contour map representations of the IDP propensity P(IDP|q, h). The legends (%) represent the probability of being an IDP P(IDP|q, h) for each (q, h) combination.

