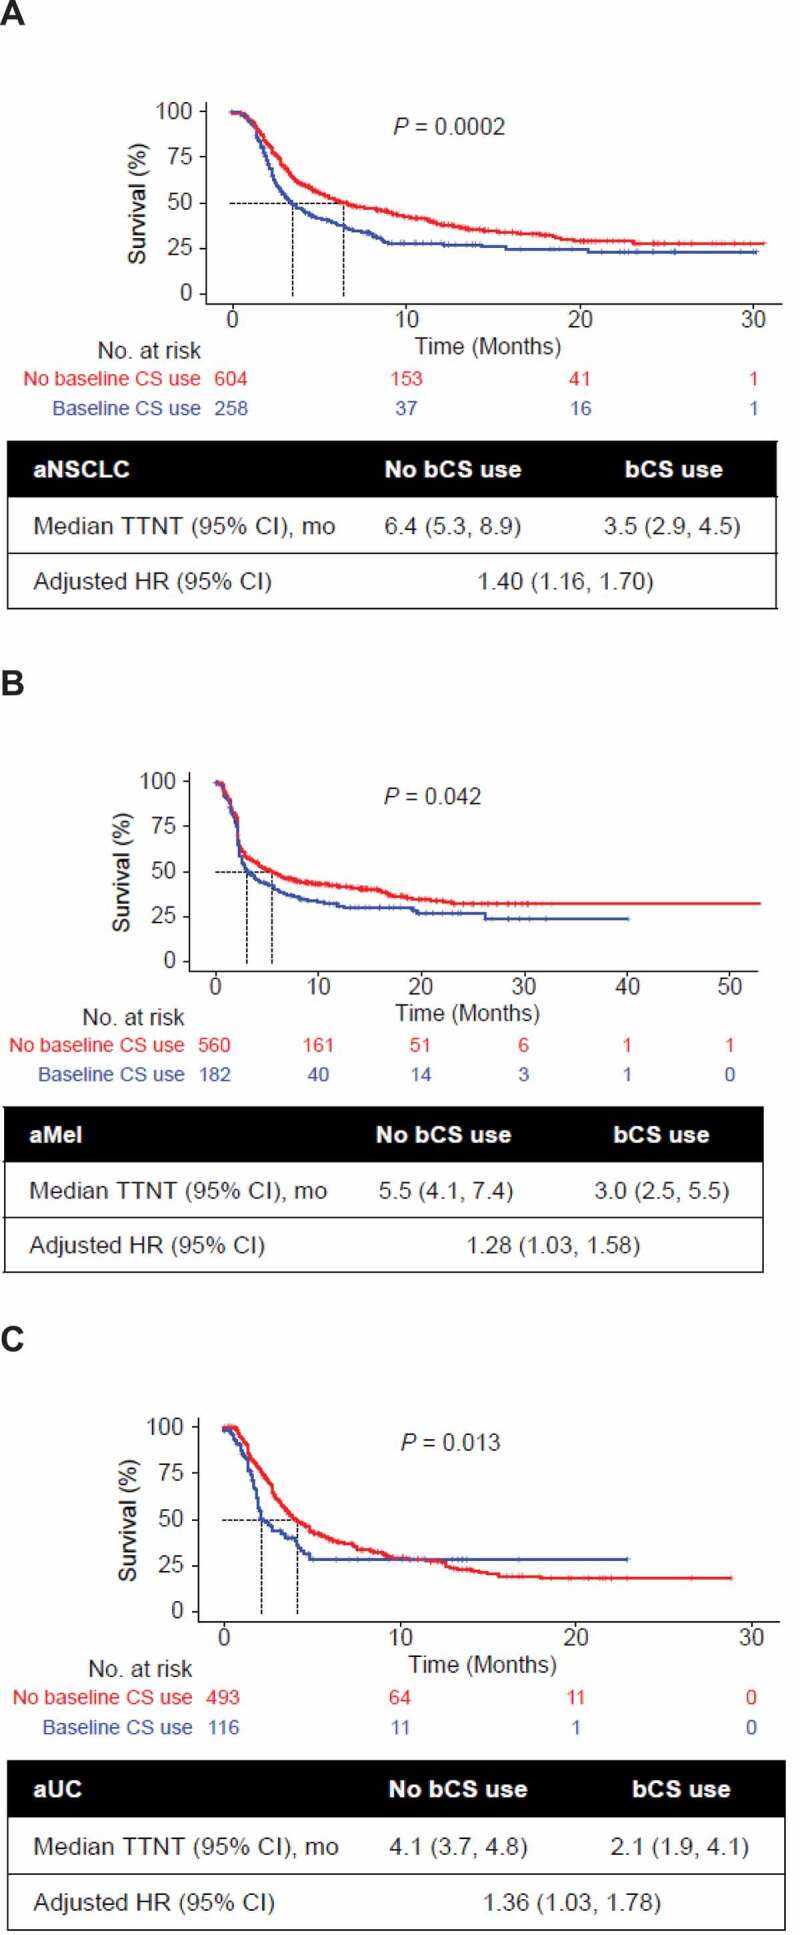
Figure 2.

Univariate Kaplan-Meier curves of TTNT by bCS use and tumor type. Analyses are shown for patients with (a) aNSCLC, (b) aMel, and (c) aUC. The base model adjusted for baseline demographic and clinical characteristics including prior CS use (yes/no), age at CPI start, sex, stage at initial diagnosis (0-II, IIIA, IIIB, IV, missing), race/ethnicity (White, other, missing), Eastern Cooperative Oncology Group performance status at CPI start (< 2, 2+, missing), modified Charlson Comorbidity Index (CCI) score, treatment sequence, brain metastases, smoking status (aNSCLC, aUC), histology (aNSCLC; squamous, nonsquamous, not specified) and grade (aUC). P values were generated by log-rank test. aMel, advanced melanoma; aNSCLC, advanced non-small-cell lung cancer; aUC, advanced urothelial carcinoma; bCS, baseline corticosteroid; CPI, immune checkpoint inhibitor; HR, hazard ratio; TTNT, time to next treatment.
