
Figure 3.
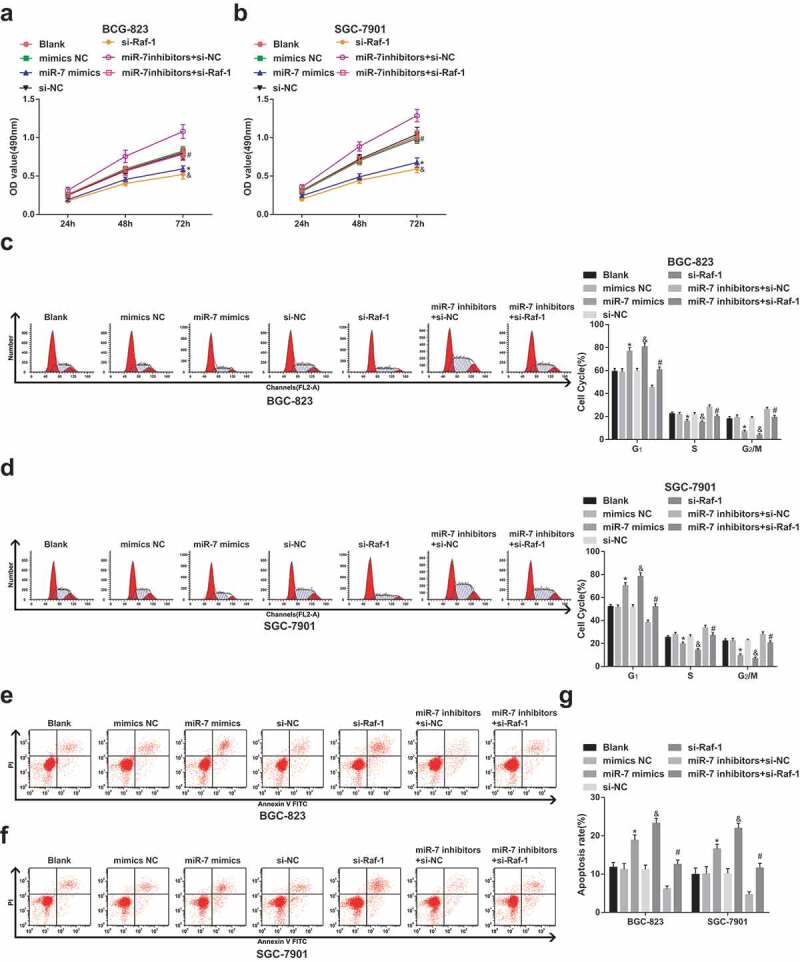
GC cell proliferation is depressed and apoptosis is promoted in vitro by elevated miR-7 and reduced Raf-1. (a)&(b). The change of BCG-823 and SGC-7901 cell proliferation ability after transfection; (c)&(d). The comparison of cell cycle distribution; (e–g). The comparison of cell apoptosis rate; * vs the mimics NC group, P < 0.05; & vs the si-NC group, P < 0.05; # vs the miR-7 inhibitors + si-NC group, P < 0.05; Measurement data were mean ± standard deviation of three independent experiments. One-way ANOVA was utilized for data analysis, followed by Tukey’s multiple comparisons test.