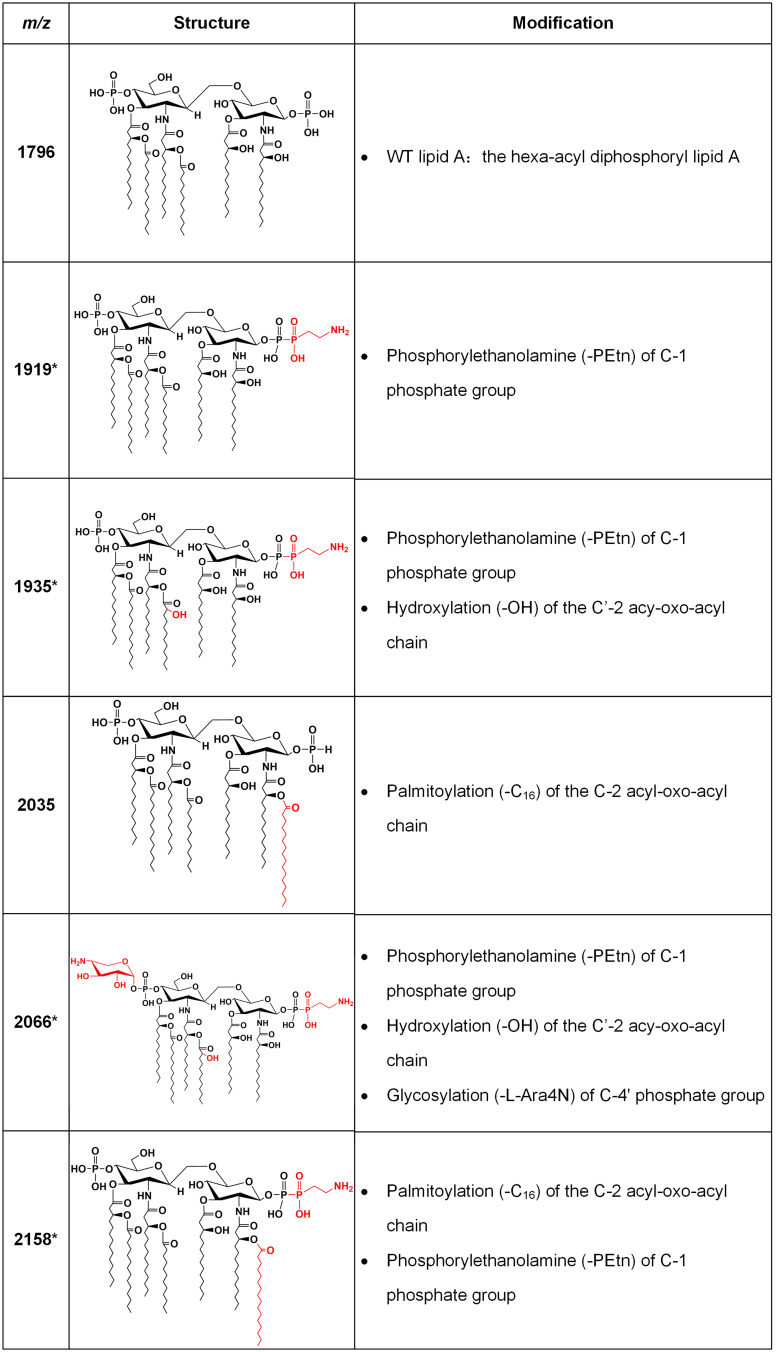
Figure 5.
Lipid A structures with corresponding m/z values found in clinical isolates. Lipid A m/z values and molecular structures found in mass spectra of the E. coli clinical isolates are shown, with descriptions of the modifications responsible for the observed mass shifts. The asterisks denote ions associated with colistin resistance. The modified moieties are highlighted in red.

