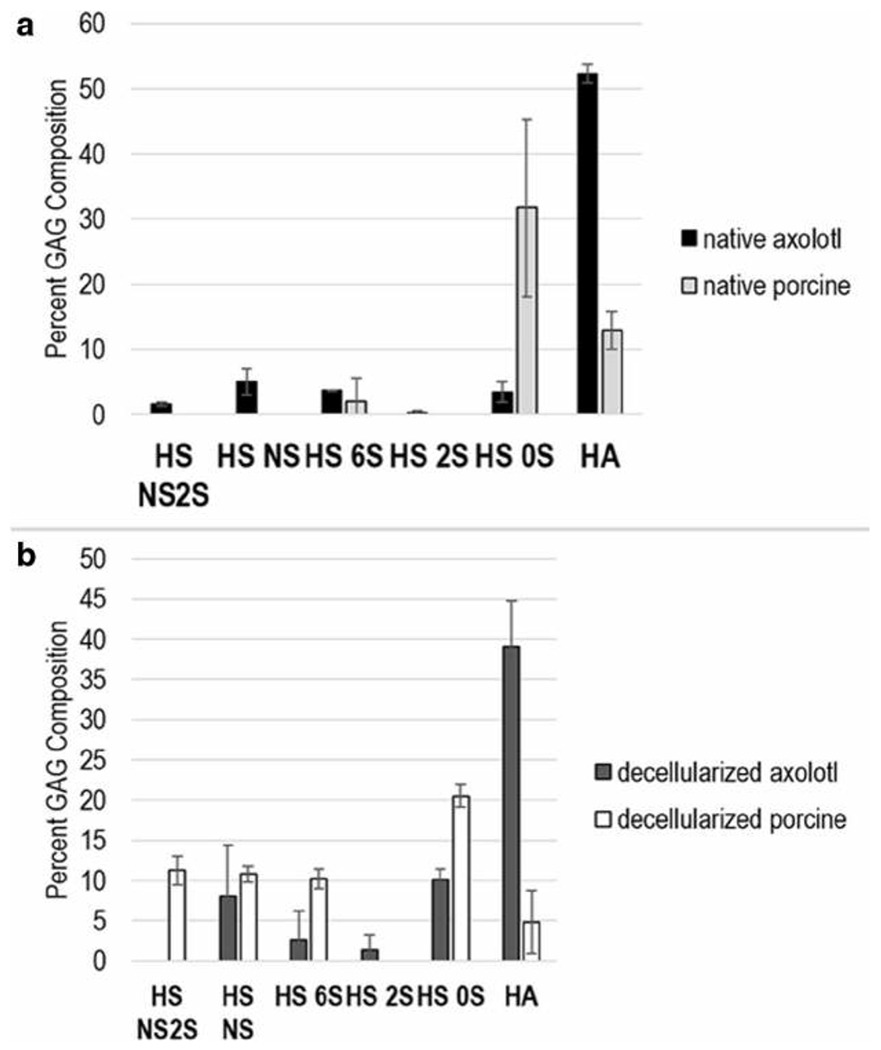
Fig. 4.

a GAG composition profile of HS and HA disaccharides from native axolotl and porcine retina. b GAG composition profile of total HS and HA disaccharides from decellularized axolotl and porcine retina. The error bars indicate standard deviation from the biological variability (four axolotl and six porcine for both native and decellularized). Each biological sample was run in triplicates (these error bars not shown)
