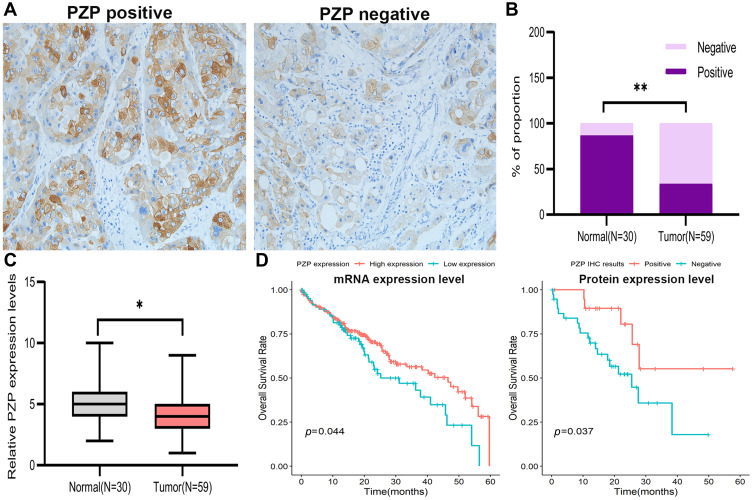
Figure 2.
PZP expression in clinical tumor samples and its correlations with clinical outcomes in HCC. (A) PZP protein expression in HCC. EnVision ×200. (B, C) PZP protein and mRNA expression in normal tissues and HCC tissues. (D) OS was compared between patients with or without lower PZP expression according to mRNA expression level (D left) and protein expression level (D right). *p<0.05,**p<0.001.

