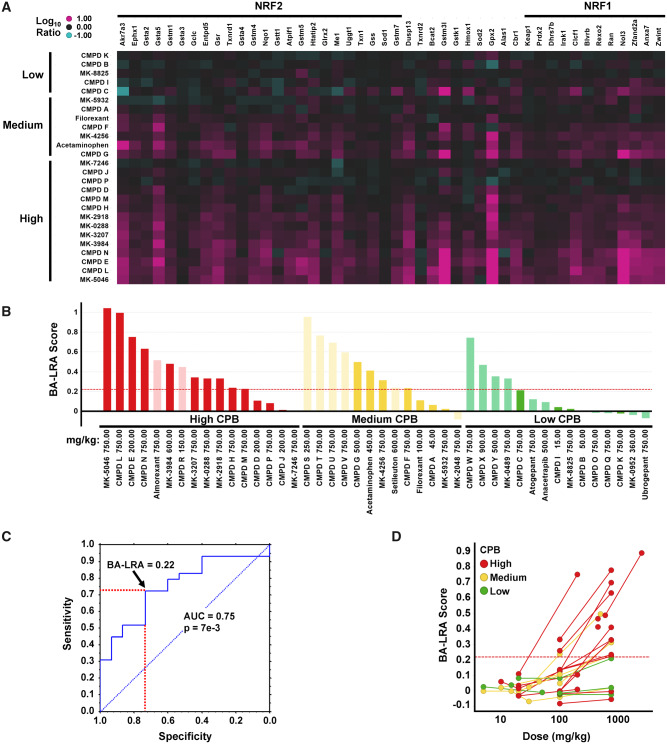
Figure 2.
Differentiation of compounds with varying degrees of covalent protein binding (CPB) by bioactivation liver response assay (BA-LRA). A, Heatmap of Affymetrix Log10 RNA expression ratio values in liver from compound treated versus respective vehicle rat controls for the training set of compounds with low (< 50), medium (50–200), or high (> 200) covalent binding (pmol-eq/mg protein) in human hepatocytes. Compounds are ordered by covalent-binding category. Genes are arranged by signature loading coefficients [10] for nuclear factor erythroid 2-related factor 2 (NRF2) (left side of heatmap from high to low) or nuclear factor erythroid 2-related factor 1 (NRF1) (right side of heatmap from low to high). B, Barplots of BA-LRA signature scores for the training (dark) and test (pale) compounds with low (green), medium (yellow), and high (red) human hepatocytes covalent binding. Values represent Taqman data where available (confirmatory Taqman data for CMPD P, MK-5046, and MK-3207 substituted for original Affymetrix data in A), or normalized (see Materials and Methods section) values from Affymetrix or Agilent microarrays. Red dashed line = BA-LRA threshold of 0.22. C, Receiver operating characteristic analysis of the 44 training/test dataset in (B) for BA-LRA score prediction of High/Med versus low covalent-binding compounds. Red dashed lines indicate sensitivity and specificity at a BA-LRA threshold of 0.22. D, Dose-response of BA-LRA score using the 26 compound Affymetrix dataset with low (green), medium (yellow), and high (red) human hepatocyte covalent binding. Lines connect data for same compounds at multiple doses. Abbreviation: AUC, area under the curve.

