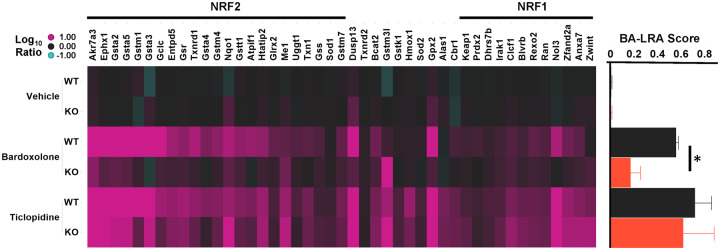
Figure 8.
Liver response in nuclear factor erythroid 2-related factor 2 (NRF2) knockout (KO) rats. Heatmap of Log10 RNA expression ratio values in liver from compound (10-mpk bardoxolone or 400-mpk ticlopidine) treated rats versus respective vehicle-treated wild type (WT) or NRF2 KO rats. Genes are arranged by signature loading coefficients [10] for NRF2 (left side of heatmap from high to low) or NRF1 (right side of heatmap from low to high). Bar plot indicates mean bioactivation liver response assay (BA-LRA) score ± SD for the respective experimental groups in the heatmap; *t test p = .002.

