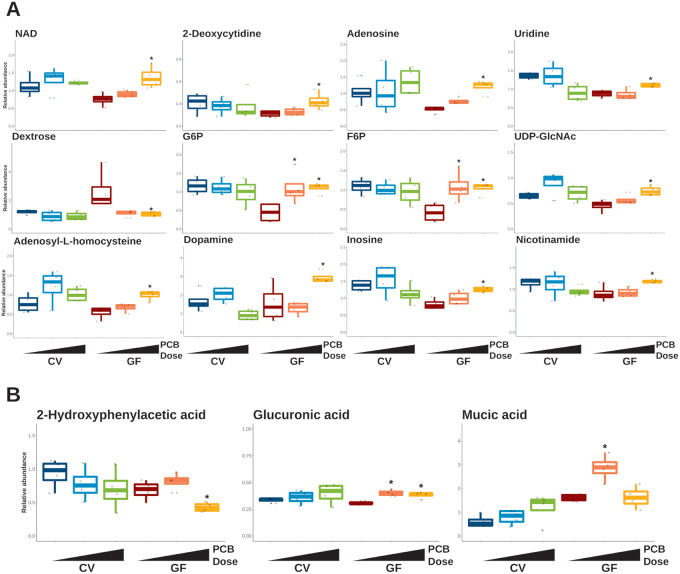
Figure 4.
Selected liver and serum metabolites differentially abundant in germ-free (GF) mice exposed to polychlorinated biphenyls (PCBs). Box plots of differentially abundant metabolites in liver (A) and serum (B). Data are shown as relative abundance. The asterisks represent differential abundance in GF groups exposed to PCBs. Abbreviation: CV, conventional.

