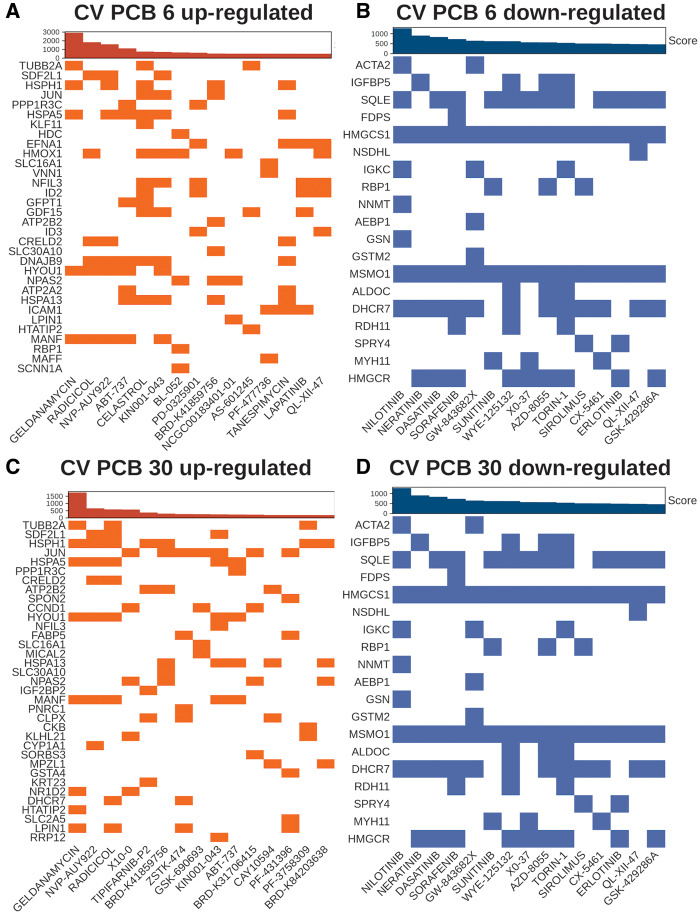
Figure 6.
Potential therapeutics from gut microbiome-dependent polychlorinated biphenyl (PCB) exposure. Drugs and small molecule (columns) and their respective target genes (rows) in human cell lines. Top bar plot represents the combined score using the adjusted p value and odds ratio. Top 15 inversely correlated target signatures with the differentially regulated genes from PCB exposure are shown. Upregulated target genes from exposure to drugs and small molecules (downregulated from PCB low and or high exposure) are highlighted in orange (A and B, respectively). Downregulated target genes from exposure to drugs and small compounds (upregulated from PCB low or high exposure) are highlighted in blue (C and D, respectively). Abbreviation: CV, conventional.

