
Figure 4.
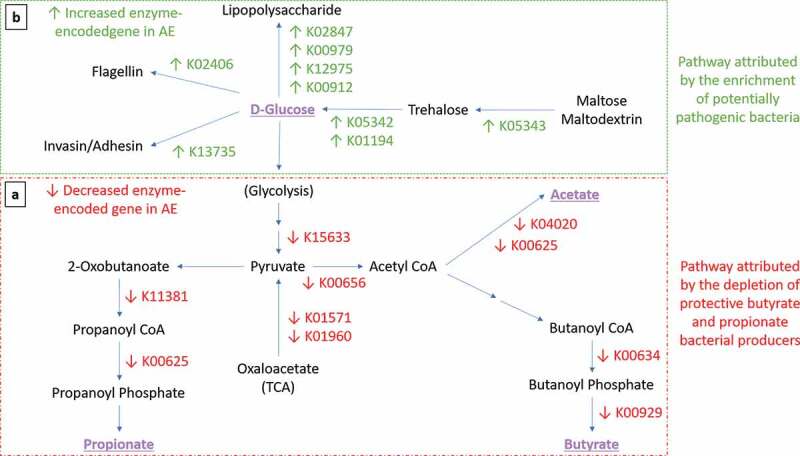
Expression of functional gene profile for carbohydrates metabolism in AE group. Arrows indicate significant differential expression of functional gene in AE compared to control group (p < .05). (a-Red Box) Perturbation of carbohydrate metabolism attributed by the depletion of butyrate- and propionate-producing bacteria. Several key carbohydrate metabolism genes were significantly reduced in AE (adj p < .05) from the glycolysis pathway (K15633 2,3-bisphosphoglycerate-independent phosphoglycerate mutase, K01571 oxaloacetate decarboxylase and K01960 pyruvate carboxylase subunit B); butyrate biosynthesis pathway (K00634 phosphate butyryltransferase, K00929 butyrate kinase); acetate biosynthesis pathway (K04020 phosphotransacetylase, K00625 phosphate acetyltransferase) and propionate biosynthesis pathway (K01734 methylglyoxal synthase, K00005 glycerol dehydrogenase, K01699 propanediol dehydratase, K13922 propionaldehyde dehydrogenase, K11381 2-oxoisovalerate dehydrogenase, K00625 phosphate acetyltransferase). (b-Green Box) Pathway attributed by the enrichment of potentially pathogenic bacteria. In contrast, several key genes were found to be enriched in AE compared to controls (adj p < .05) in the trehalose metabolism pathway (K05343 maltose alpha-D-glucosyltransferase/alpha-amylase, K05342 alpha,alpha-trehalose phosphorylase and K01194 alpha,alpha-trehalase); lipopolysaccharide (LPS) biosynthesis (K02847 O-antigen ligase, K00979 3-deoxy-manno-octulosonate cytidylyltransferase, K12975 KDO II ethanol-amine-phosphotransferase and K00912 tetra-acyl-disaccharide 4ʹ-kinase) and virulence components biosynthesis pathways (K13735 adhesin/invasin, K02406 flagellin). List of metatranscriptomics functional annotation that are significantly different between AE and controls is shown in Supplementary Table 5.