
Figure 6.
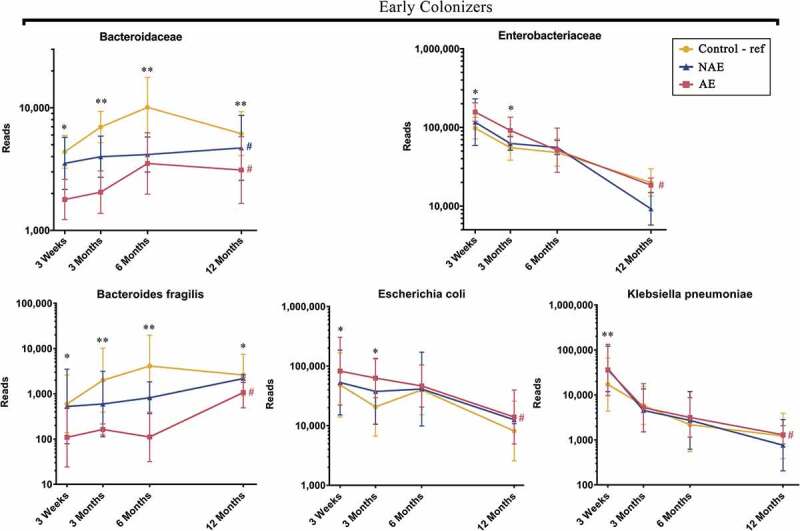
Longitudinal maturation of three early colonizers namely Bacteroides fragilis (Bacteroidaceae family), Escherichia coli (Enterobacteriaceae family) and Klebsiella pneumoniae (Enterobacteriaceae family). Data are presented as geometric mean and geometric standard deviation range of reads in log-scale. Different y-axis scales between graph were used to highlight the difference of microbiota between groups. Linear mixed-model and general linear model were used to assess difference of abundance between the eczema (AE/NAE) and control (reference) groups adjusting for confounders (gender, birth order, mode of delivery, breastfeeding till 6 months, antibiotics at labor and family of atopic history). Comparison of key colonizers at individual timepoints and longitudinal mean differences between eczema (NAE or AE) and control (reference) were listed in Supplementary Table 1b. *Significant difference at adj p < .05 between AE only and control group at specific time point. **Significant difference at adj p < .05 between both AE and NAE compared to control groups at specific time point. # (blue) annotates significant longitudinal difference between NAE and control at adj P < .05. # (red) annotates significant longitudinal difference between AE and control at adj P < .05. Sample size at 3 weeks – Control (n = 13) vs NAE (n = 5) vs AE (n = 5); 3 months – Control (n = 16) vs NAE (n = 11) vs AE (n = 10); 6 months – Control (n = 27) vs NAE (n = 9) vs AE (n = 14) and 12 months – Control (n = 26) vs NAE (n = 8) vs AE (n = 18).