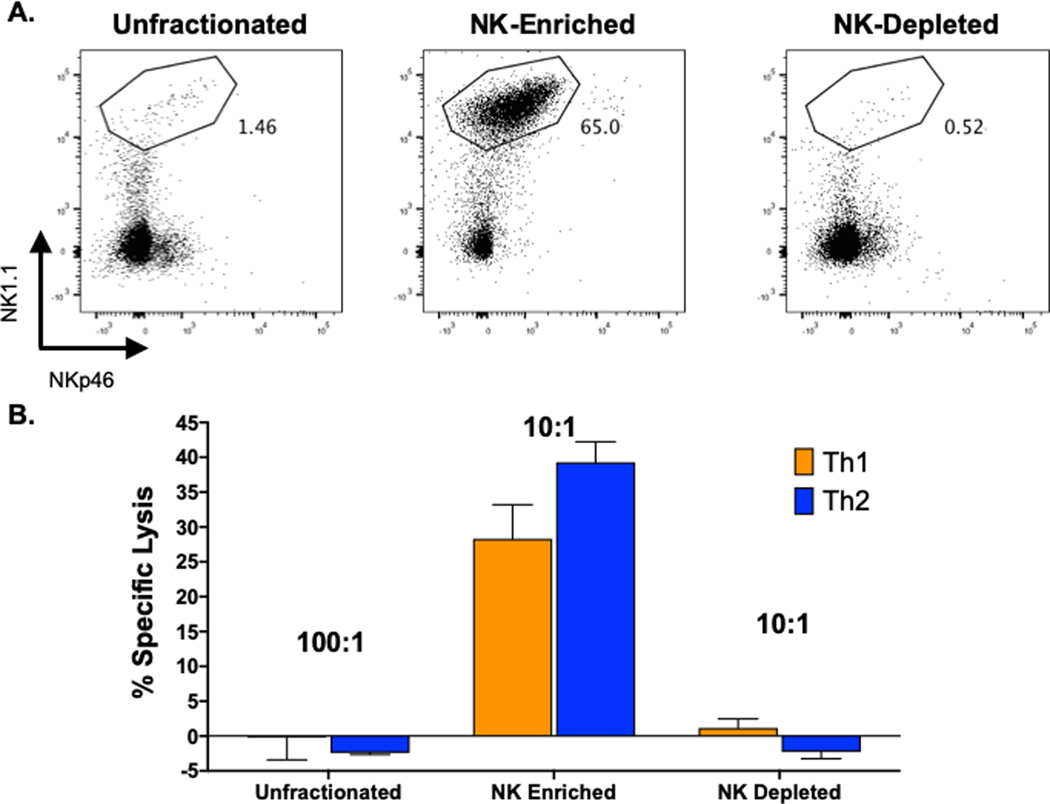
Figure 3. MACS column-enrichment of NK cells and lysis of differentiated T cell cultures.
NK cells were partially purified from spleen leukocytes from day 3 LCMV-infected C57BL/6 mice and tested in 4-hour 51Cr-release cytotoxicity assays against Th1 and Th2 cultures. A. Upper panels are low cytometry plots against NK1.1 (y-axis) and NKp46 (x-axis). Boxes in upper panels represent %NK1.1+ cells. B. Unfractionated cytotoxicity data are plotted at E:T = 100:1, whereas enriched and depleted samples are plotted at E:T =10:1.

