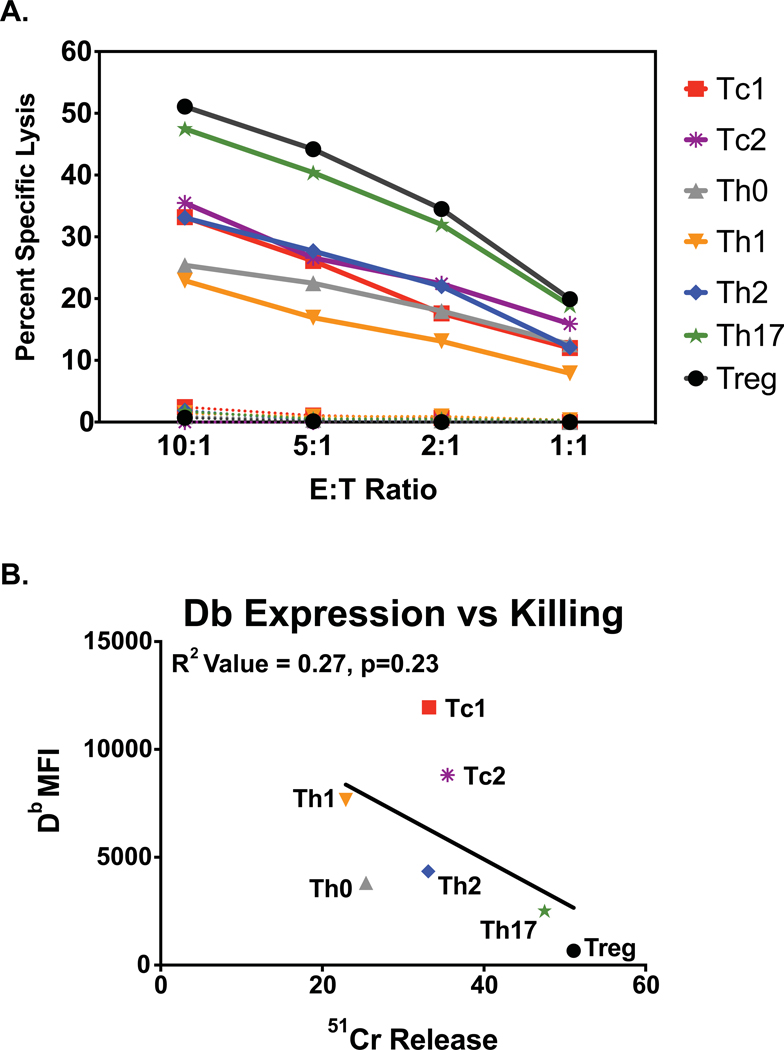
Figure 4. Hierarchy of killing of differentiated T cell cultures.
A. In a single experiment all studied effector T cell subset cultures were tested for susceptibility to killing by NK cell-enriched populations of LCMV day 3 spleen leukocytes (solid lines) or by the NK cell-depleted population (dotted lines). Data are from a 4-hour 51Cr-release cytotoxicity assay. B. Correlation of cell surface expression of class 1 Db antigens, as analyzed by flow cytometry, with cytotoxicity (E:T=5:).

