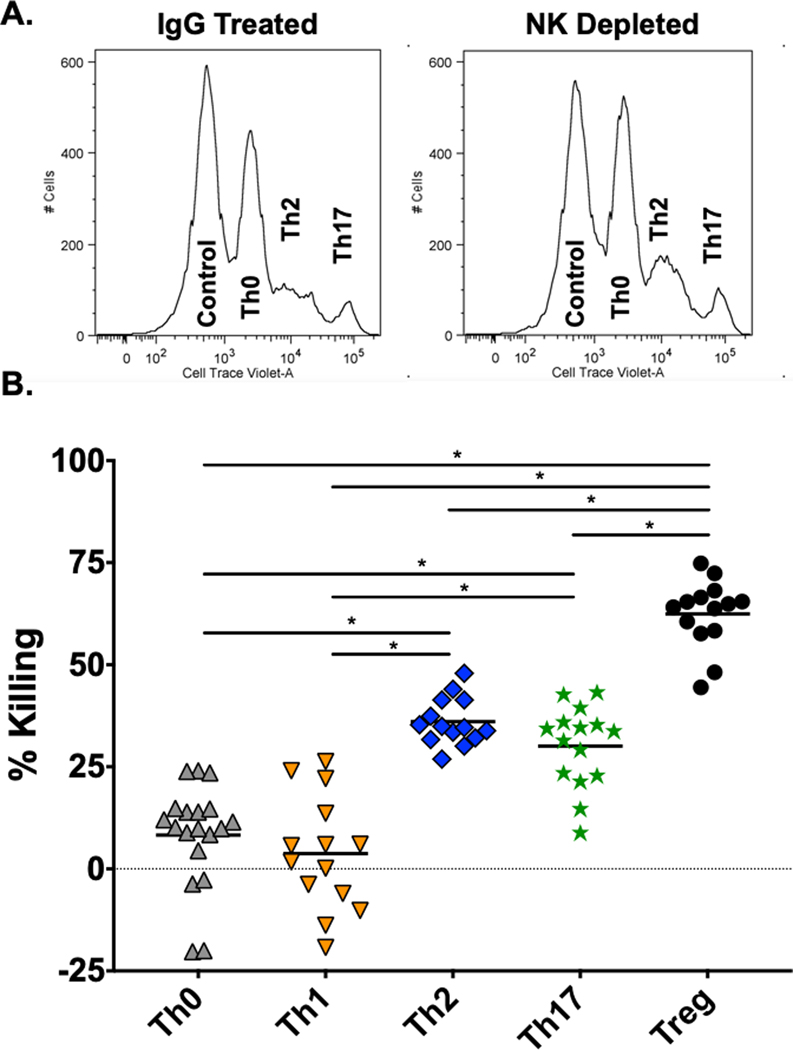
Figure 6. In vivo cytotoxicity assay against differentiated T cell cultures.
This depicts in vivo cytotoxicity assays against cultured differentiated CD4 T cells by displaying the cytotoxic values in individual mice from 2–3 experiments per T cell subset. Details of this assay are in the Materials and Methods section. A. Representative histograms showing the survival of cell populations in NK cell replete (control IgG-treated) vs. anti-NK1.1-depleted mice. The T cell subsets are identified by the concentration of the cell trace violet dye. B. Panel showing that the cytotoxicity against Treg, Th17, and Th2 cells was significantly greater than that against the Th0 and Th1 cells, as determined by Students t test (p<0.0001).

