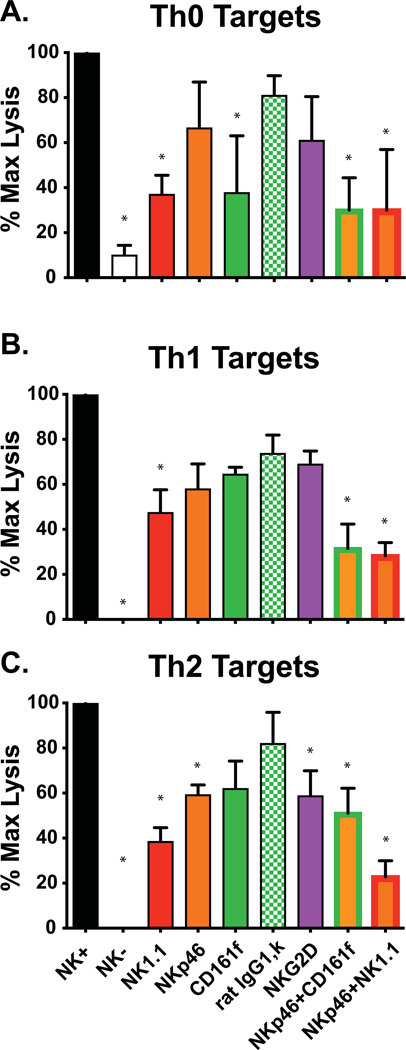
Figure 9. Blockade of NK cell-mediated cytotoxicity against differentiated T cell cultures.
Panels A, B, and C represent cytotoxicity assays against Th0, Th1, and Th2 cultures by NK cell-enriched day 3 LCMV-induced spleen leukocyte populations in 4-hr 51Cr-release cytotoxicity assays, at E:T ratio = 5:1. These were added to all samples except those in the second column, which received NK-cell depleted leukocytes from day 3 LCMV-infected mice.. Except for the first two columns, additional agents were added to block the killing. These include mAb to NKR or combinations of anti-NKR mAb. The green hatched bar represents killing in the presence of a rat IgG1, k control mAb with no specificity to NK cells. *p< .05; **, p<.00.5

