
Figure 2. Gene-specific Mendelian randomization estimates (odds ratio with 95% confidence interval per one standard deviation increase in lipid fraction) for variants in gene regions representing targets of lipid-lowering treatments.
Estimates are scaled to a one standard deviation increase in LDL-cholesterol for the HMGCR, PCSK9, LDLR, and NPC1L1 regions, and a one standard deviation increase in triglycerides for the APOC3 and LPL regions. A: associations with overall cancer for each gene region in turn. B: associations with site-specific cancers for variants in the HMGCR gene region.

Figure 2—figure supplement 1. Gene-specific Mendelian randomization estimates (odds ratio with 95% confidence interval per one standard deviation increase in LDL-cholesterol) for variants in the PCSK9 gene region.

Figure 2—figure supplement 2. Gene-specific Mendelian randomization estimates (odds ratio with95%confidence interval per one standard deviation increase in LDL-cholesterol) for variants in theLDLRgene region.

Figure 2—figure supplement 3. Gene-specific Mendelian randomization estimates (odds ratio with 95% confidence interval per one standard deviation increase in LDL-cholesterol) for variants in theNPC1L1gene region.

Figure 2—figure supplement 4. Gene-specific Mendelian randomization estimates (odds ratio with 95% confidence interval per one standard deviation increase in LDL-cholesterol) for variants in theAPOC3gene region.

Figure 2—figure supplement 5. Gene-specific Mendelian randomization estimates (odds ratio with 95% confidence interval per one standard deviation increase in LDL-cholesterol) for variants in theLPLgene region.

Figure 2—figure supplement 6. Genetic associations with LDL-cholesterol (standard deviation units) plotted against genetic associations with overall cancer (log odds ratios) for six variants in the HMGCR gene region.
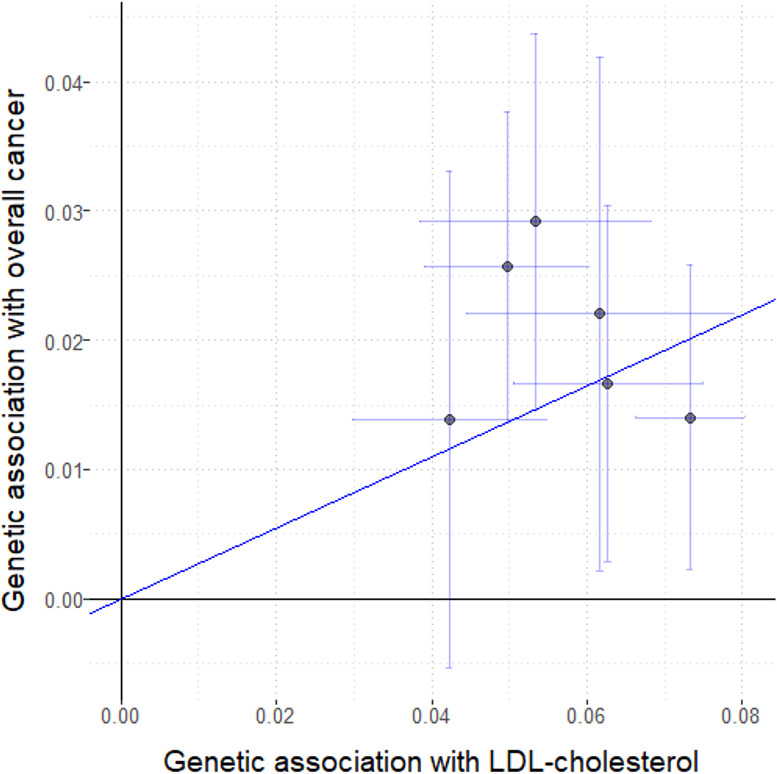
Figure 2—figure supplement 7. Gene-specific Mendelian randomization estimates (odds ratio with 95% confidence interval per one standard deviation increase in LDL-cholesterol) for variants in the HMGCR gene region excluding self-reported outcomes.

Figure 2—figure supplement 8. Gene-specific Mendelian randomization estimates (odds ratio with 95% confidence interval per one standard deviation increase in LDL-cholesterol) for variants in the HMGCR gene region excluding those with a cancer diagnosis other than site-specific cancer under analysis.
