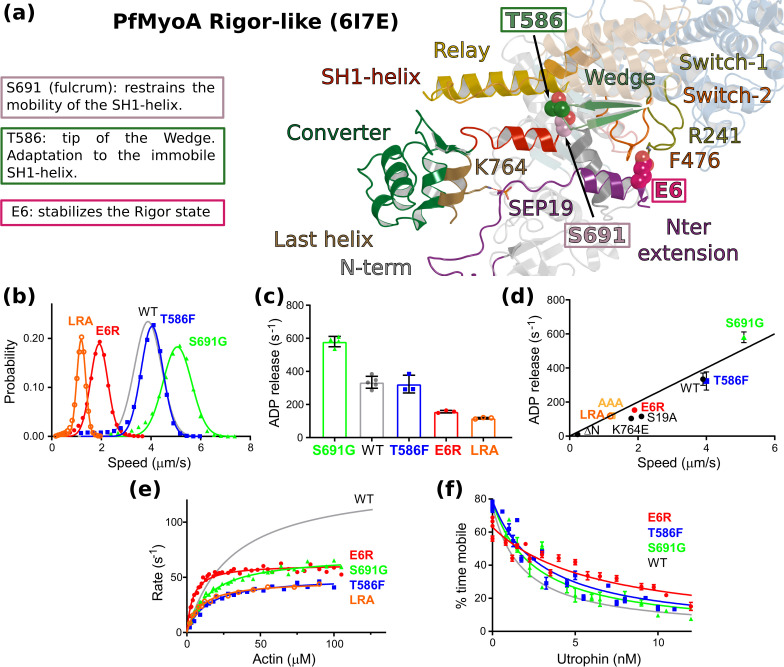
Figure 2. Sequence adaptations tune distinct transitions of the cycle.
(a) Location and function of three mutated residues. (b) Speed distributions from representative in vitro motility assays. Supplementary file 1b shows values from additional experiments. (c) ADPrelease rates from acto-PfMyoA. WT data are from Robert-Paganin et al., 2019. Data for LRA (three experiments, two protein preparations); E6R (three experiments, three protein preparations); T586F (three experiments, two protein preparations); S691G (four experiments, three protein preparations). Values, mean ± SD. (d) Correlation of ADP -release rates and in vitro motility speed. (e) Actin-activated ATPase activity. WT data are from Robert-Paganin et al., 2019 . Data from at least two protein preparations and two experiments for each construct were fitted to the Michaelis-Menten equation. Error, SE of the fit. (f) Ensemble force measurements using a utrophin-based loaded in vitro motility assay. A myosin that produces more force requires higher utrophin concentrations to slow motion: E6R, 4.02 ± 0.31 nM; T586F, 2.38 ± 0.18 nM; S691G, 1.99 ± 0.19 nM; WT, 1.40 ± 0.08 nM. WT data are from Robert-Paganin et al., 2019. Error, SE of the fit. Data from two protein preparations and three experiments for each mutant construct. Figure 6—figure supplement 1d shows additional data with an expanded x-axis. Skeletal actin was used for all experiments. Temperature, 30°C. See also Supplementary file 1b for values.

