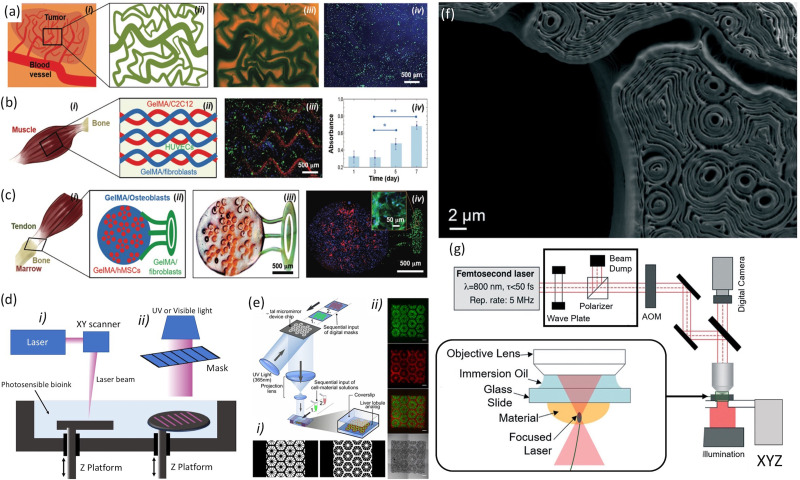
FIG. 1.
(a) A tumor angiogenesis model: (i) schematic showing the tumor angiogenesis model; (ii) schematic of the mask for printing; (iii) bioprinted microvasculature; and (iv) bioprinted tumor model. (b) A skeletal muscle model: (i) schematic showing the skeletal muscle tissue; (ii) schematic of the mask for printing; (iii) bioprinted skeletal tissue model; and (iv) PrestoBlue measurements of cell proliferation in the bioprinted structures. (c) A tendon-to-bone insertion model: (i) schematic of the tendon-to-bone insertion site; (ii) schematic of the mask for printing; (iii) bright-field optical image showing a bioprinted dye-laden GelMA structure; and (iv) bioprinted tendon-to-bone model. Reproduced with permission from Miri et al., Adv. Mater. 30, 1800242 (2018). Copyright 2018 John Wiley and Sons. (d) Schematics of stereolithographic bioprinting process: (i) laser-based and (ii) mask-based. (e) Schematic of the DLP bioprinting process: (i) gray scale digital mask and (ii) images of fluorescently labeled hiPSC-derived hepatic progenitor cells (hiPSC-HPCs). Reproduced with permission from Ma et al., Proc. Natl. Acad. Sci. U. S. A. 113, 2206–2211 (2016). Copyright 2016 PNAS. (f) The cross section of a TPP-bioprinted mouse paw bone imaged using scanning electron microscopy and the intricate contours within the structure that arose from the bioprinting process. (g) Schematic illustration of the experimental setup for two-photon bioprinting along with a zoomed description of focal plane and distribution of light intensity in the laser focus of a Gaussian beam is shown. Images (f) and (g) were reproduced with permission Miri et al., Lab Chip 19, 2019–2037 (2019).50 Copyright 2019 Royal Society of Chemistry.

