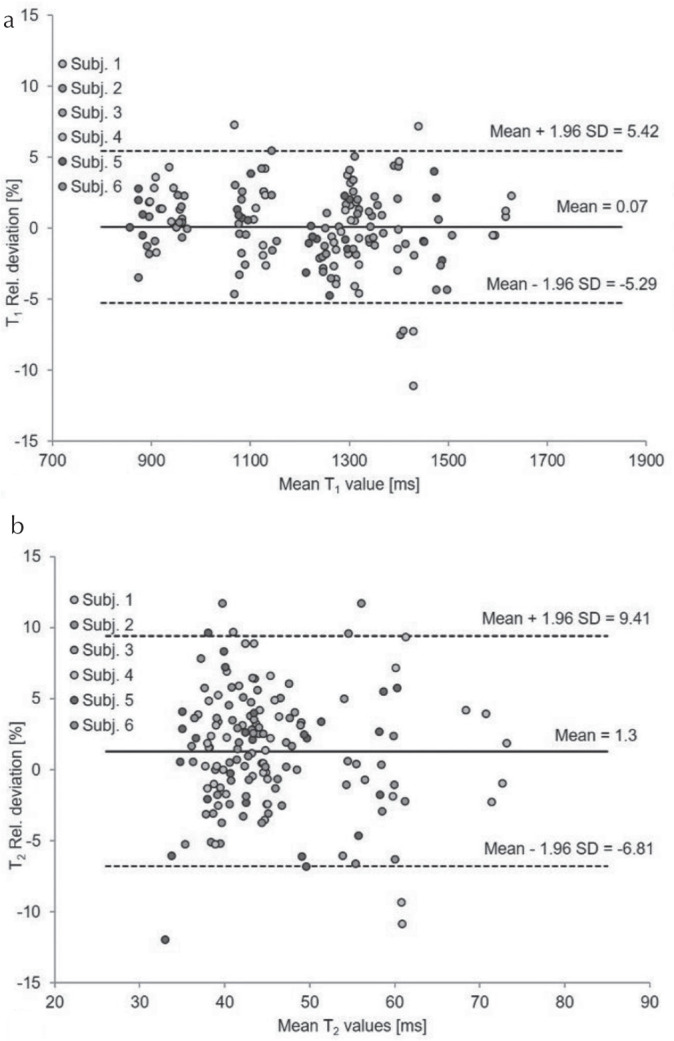
Fig. 7.

Relative deviation of T1 (a) and T2 (b) values obtained from -corrected fast imaging with steady-state precession (FISP–MRF) on volunteers in two scanners displayed as Bland–Altman plots showing the cross-scanner reproducibility. SD, standard deviation.
