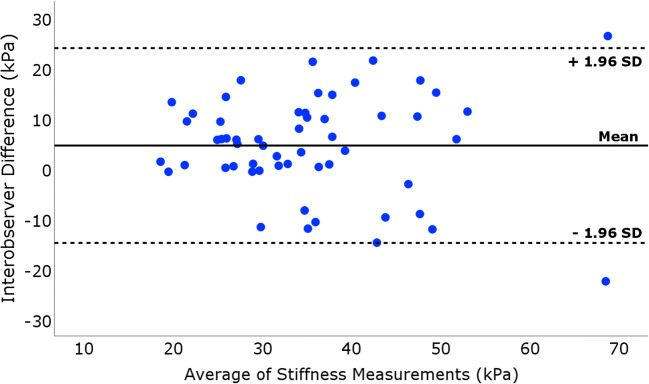
Fig. 4.
Interobserver reliability of bilateral SWE in twenty-eight healthy athletes. Bland-Altman plot illustrating the interobserver reliability for the patellar tendon stiffness assessment using SWE. The differences between each pair of the two examiners’ stiffness measurements plotted on the y-axis are shown against the mean of these measurements on the x-axis. The solid line represents the mean value and dashed lines represent the limits of agreement, defined as mean ± 1.96SD

