
Figure 1.
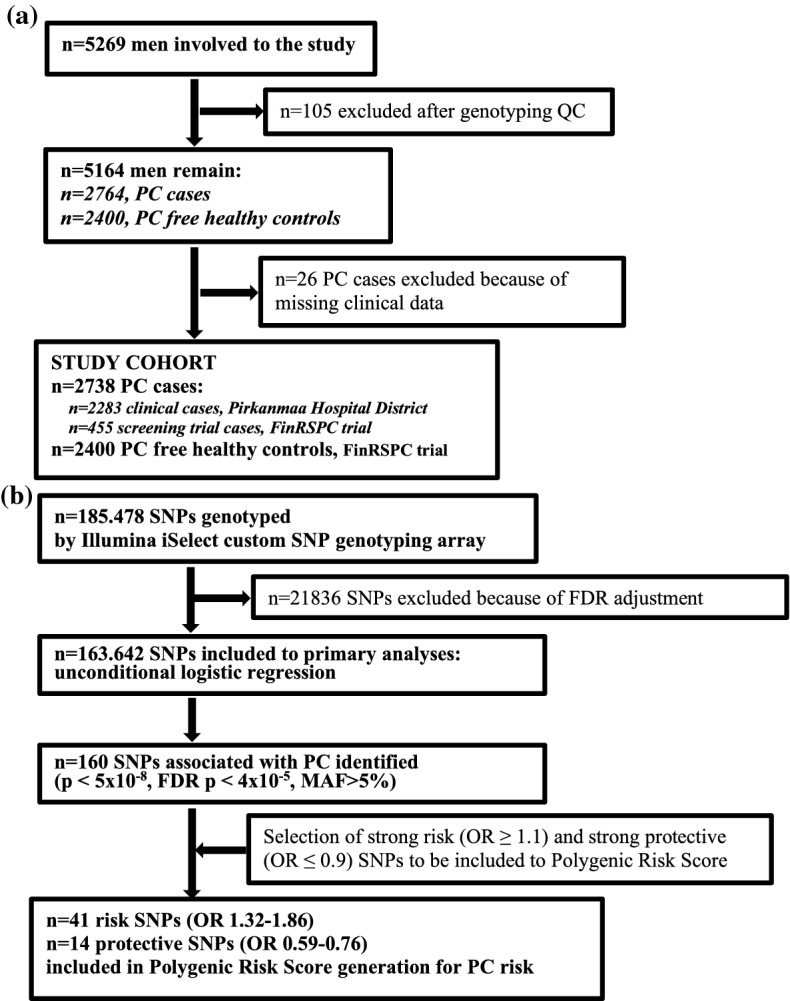
Flow diagram presenting the steps of participant's enrollment to the study (a) and selection of SNPs for polygenic risk score (b) QC, quality control; FDR, false discovery rate, corrected by Benjamini–Hochberg method.
Official websites use .gov
A
.gov website belongs to an official
government organization in the United States.
Secure .gov websites use HTTPS
A lock (
) or https:// means you've safely
connected to the .gov website. Share sensitive
information only on official, secure websites.
Flow diagram presenting the steps of participant's enrollment to the study (a) and selection of SNPs for polygenic risk score (b) QC, quality control; FDR, false discovery rate, corrected by Benjamini–Hochberg method.