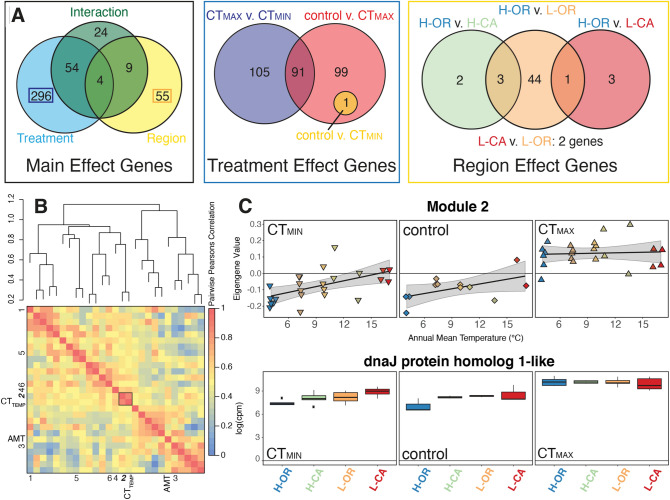
Figure 2.
Summary of differential gene expression analysis patterns. (A) Venn diagrams summarizing the total number of genes demonstrating significant FDR-corrected (5%) effects, including (left) genes with treatment, region, or interaction effects, (center) genes differentially expressed among CTMAX, CTMIN, and control treatments for the 296 genes exhibiting treatment effects alone, and (right) 55 genes with region effects alone. See Dataset S2G for details. (B) Network analysis of co-expression with WGCNA grouped genes into 26 modules, six of which (labeled 1–6 on heat map edges) demonstrated a significant relationship (likelihood ratio test, P < 0.05) with critical thermal temperature (CTTEMP), Annual Mean Temperature (AMT), or some combination of the two. The strongest relationship was observed for Module 2 with CTTEMP (black box; Dataset S3). (C) The eigengene value (expression analog) of module 2 genes (top) and expression of the module 2 hub gene, dnaJ protein homolog 1-like (bottom) as functions of Annual Mean Temperature for each treatment.

