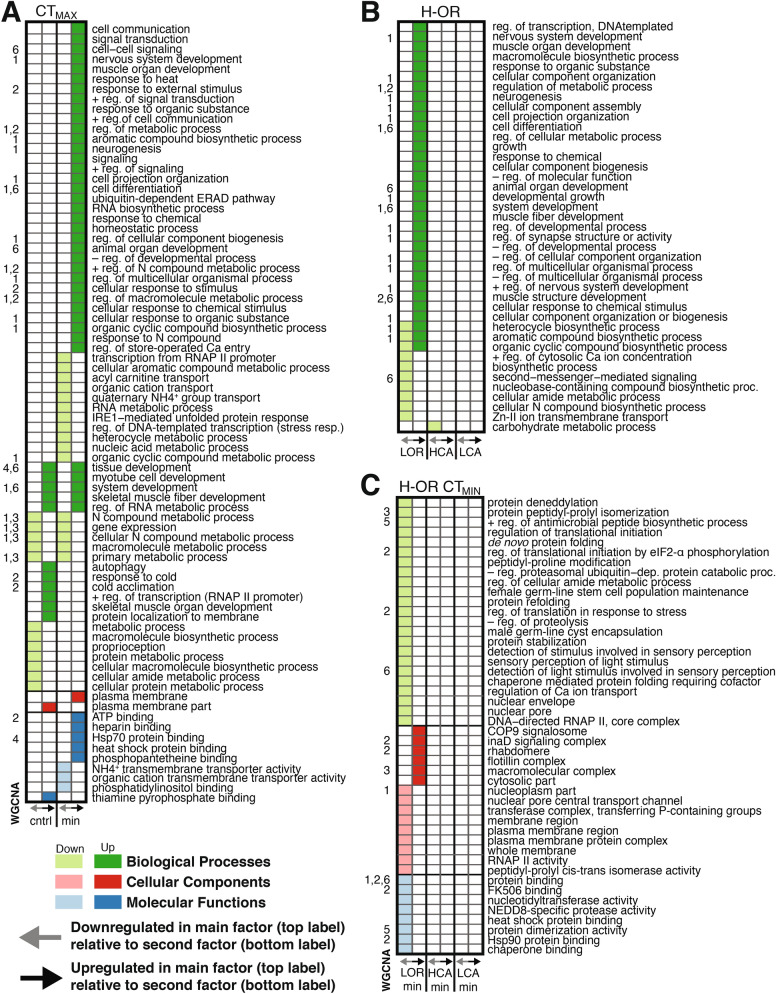
Figure 3.
Gene Ontology enrichment analysis of edgeR/limma and WCGNA results. Significantly enriched gene ontology terms identified in edgeR/limma are listed on the rows for different contrasts, with information on the WCGNA modules (1–6) that are also enriched for that term. Each panel has a different main factor for the contrast (top label), with GO enrichment in genes with decreased or increased expression in the main factor relative to the contrast factor (bottom label). (A) Treatment comparisons (control and CTMIN) against CTMAX treatment, presenting full GO analysis results (Dataset S2) reduced with ReViGO and further filtered to include common terms from other thermal stress studies for the purposes of presentation clarity. (B) Region comparisons (L-CA, H-CA, and L-OR) against H-OR bees, with terms reduced as in (A). (C) Regional CTMIN comparisons (L-CAMIN, H-CAMIN, and L-ORMIN) against H-ORMIN bees. GO terms were summarized with ReViGO but did not require further filtering for presentation clarity. Complete sets of GO terms for all edgeR/Limma and WCGNA results are provided in Datasets S1 and S2, respectively.

