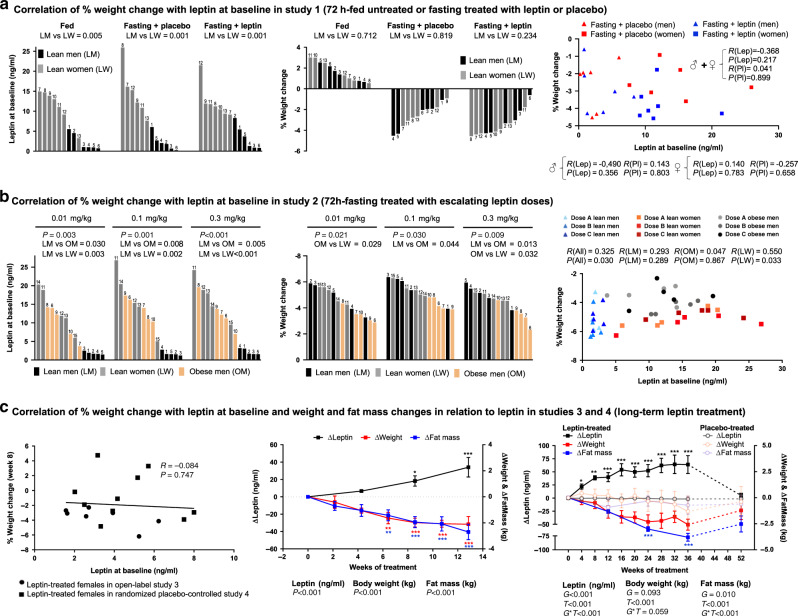
Fig. 2. Leptin effects on weight and fat mass.
a Cross-over study of lean subjects during 72-h fed state, fasting+placebo and fasting+leptin (study 1; n = 13). Left: baseline leptin levels in each admission. Center: % weight change at the end of each admission. Right: correlation of baseline leptin with % weight change at the end of each admission. Numbers above bars correspond to subject ID. P values of unpaired t test between lean men (LM) vs lean women (LW) and of correlations are reported; R, correlation coefficient. b Cross-over study of LM, LW, and obese men (OM) in 72-h fasting treated with escalating leptin doses (study 2; n = 15). Left: baseline leptin levels in each admission, Center: % weight change at the end of each admission. Right: correlation of baseline leptin with % weight change at the end of each admission. Numbers above bars correspond to subject ID. P values from one-way ANOVA, from post hoc Bonferroni test between LM vs LW vs OW and from correlations are reported. c Open-label (study 3; n = 7) and placebo-controlled long-term leptin treatment study (study 4; n = 19 (leptin = 10; placebo = 9)) in women with mild hypoleptinemia. Left: correlation of baseline leptin with % weight change after 8 weeks of leptin treatment. Subjects of study 3 were combined with leptin-treated subjects of study 4 in one analysis. Center and right: changes of leptin, body weight, and fat mass from baseline (Δ = change from baseline at each timepoint). In study 4, dashed lines correspond to the washout period after 36 weeks of study. In study 3, P values (P) for time effect (i.e., days of treatment) and in study 4, P values of G (group: leptin or placebo), T (time: weeks of treatment), and G*T interaction of mixed models adjusted for baseline are reported. By P < 0.05 (study 3) and G*T < 0.05 (study 4), post hoc Bonferroni test was performed (only significant results are reported). One, two, or three asterisks indicate P < 0.05, <0.01, or <0.001 for the specific timepoint vs baseline in study 3 and for leptin vs placebo in the specific timepoint in study 4. Correlations were performed with Pearson’s or Spearman’s correlation test. Data are presented as means ± SEMs. Exact P values: b, left: leptin at baseline dose 0.3 mg/kg = 0.003 × 10⁻¹; leptin at baseline dose 0.3 mg/kg LM vs LW = 0.003 × 10⁻¹. c Center: leptin = 0.003 × 10⁻¹; weight = 0.001 × 10⁻³; fat mass = 0.002 × 10⁻⁵; leptin post hoc test at 81/2 weeks = 0.031 and at 13 weeks = 0.003 × 10⁻¹. Weight post hoc test at 61/2 weeks = 0.002, at 81/2 weeks = 0.001 × 10⁻¹, at 11 weeks = 0.001 × 10⁻¹, and at 13 weeks = 0.001 × 10⁻¹. Fat mass post hoc test at 61/2 weeks = 0.002, at 81/2 weeks = 0.002 × 10⁻², at 11 weeks = 0.005 × 10⁻³, and at 13 weeks = 0.004 × 10⁻⁴. c, Right: leptin G = 0.005 × 10⁻²; T = 0.007 × 10⁻⁵; G*T = 0.002 × 10⁻⁵; body weight T = 0.007 × 10⁻⁵; fat mass T = 0.009 × 10⁻⁵; G*T = 0.001 × 10⁻²; leptin post hoc test at 4 weeks = 0.039; at 8 weeks = 0.001; at 12 weeks = 0.004 × 10⁻¹; at 16 weeks = 0.005 × 10⁻³; at 20 weeks = 0.003 × 10⁻²; at 24 weeks = 0.001 × 10⁻²; at 28 weeks = 0.002 × 10⁻³; at 32 weeks = 0.004 × 10⁻³; at 36 weeks = 0.002 × 10⁻³. Fat mass post hoc test at 24 weeks = 0.002 × 10⁻¹; at 36 weeks = 0.001 × 10⁻¹.

