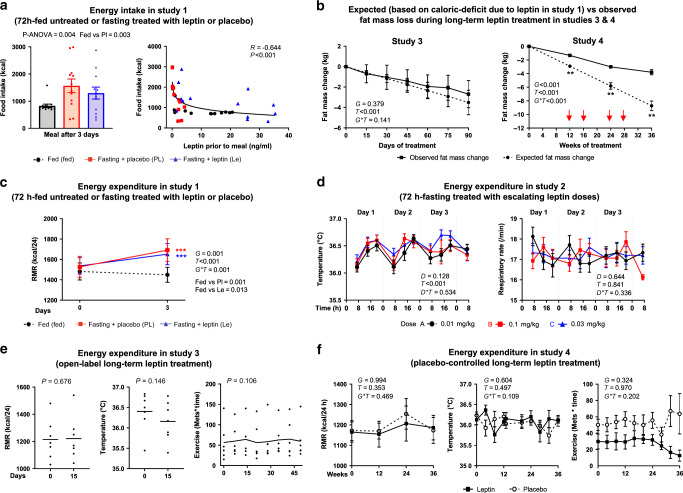
Fig. 3. Short- and long-term leptin effects on energy intake and expenditure.
a Energy intake after 72-h in fed state, fasting+placebo, or fasting + leptin (study 1, n = 13). P values from repeated measure ANOVA and post hoc Bonferroni test are reported. R, correlation coefficient. b Expected (based on leptin-induced caloric deficit in study 1) vs observed fat mass loss during long-term leptin treatment in studies 3 and 4. As per the protocol, in study 4, if a subject lost >5% of baseline weight, the dose was reduced by 0.04 mg/kg (red arrows). P values of G (group: observed or expected fat mass change), T (days/weeks of treatment), and G*T interaction of mixed models are reported. By G*T < 0.05, post hoc Bonferroni test was performed: two asterisks indicate P < 0.01 for observed vs expected fat mass change at the specific timepoint. c Energy expenditure during 72-h fed state, fasting+ placebo, and fasting + leptin (study 1, n = 13). P values of G (group: fed, fasting + placebo, fasting + leptin), T (days of treatment), and G*T interaction of mixed models adjusted for baseline are reported. Post hoc Bonferroni test was performed between the estimated means of the three groups and between the three groups at each timepoint. Three asterisks indicate P < 0.001 for fed vs fasting + placebo (red) and fed vs fasting + leptin (blue). d Energy expenditure during 72-h fasting treated with escalating leptin doses (study 2, n = 15). P values of D (dose: 0.01, 0.1, and 0.3 mg/kg/d), T (hours of fasting), and D*T interaction of mixed models adjusted for baseline are reported. e Energy expenditure during open-label long-term leptin treatment in mildly hypoleptinemic women (study 3, n = 7). P values of paired t test (RMR and body temperature) and of time effect of mixed models adjusted for baseline (exercise score) are reported. No post hoc test was performed since P > 0.05. f Energy expenditure during placebo-controlled long-term leptin treatment in mildly hypoleptinemic women (study 4, n = 19 (leptin = 10; placebo = 9)). P values of G (group: placebo or leptin), T (weeks of study), and G*T interaction of mixed models adjusted for baseline are reported. No post hoc test was performed since G*T > 0.05. All P values are two-sided. For post hoc Bonferroni test, only significant results are reported. Data are demonstrated as means ± SEMs. Exact P values: a Correlation of food intake with leptin prior to meal = 0.002 × 10⁻². b Study 4: post hoc test at 12 weeks = 0.002; at 24 weeks = 0.001; at 36 weeks = 0.003. c Day 3 fed vs Pl = 0.004 × 10⁻³; fed vs Le = 0.003 × 10⁻¹. d Temperature T = 0.002 × 10⁻¹².

