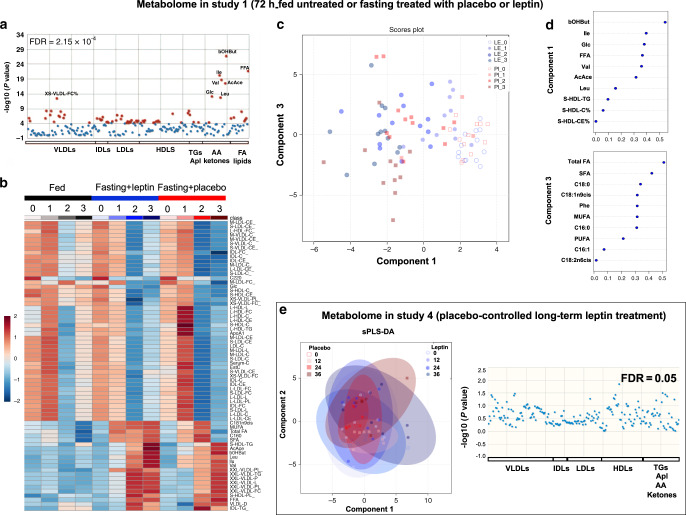
Fig. 6. Metabolome changes with short- and long-term leptin treatment.
a–d Effects on metabolite and lipid metabolism of 72-h fed state or fasting treated with leptin or placebo (study 1, n = 13). a Evaluation of metabolites, lipids, and lipoproteins with one-way ANOVA between the three admissions. Red dots indicate parameters significantly different and blue dots parameters not significantly different between groups (fed vs fasting + placebo vs fasting + leptin) with a preset false discovery rate of P < 2.15 × 10⁻⁴ (total 68 parameters significant). b Heatmap of the 68 significant parameters according to one-way ANOVA for the three admissions. c sPLS-DA analysis of fasting+leptin vs fasting + placebo: symbols indicate the measurement of component 1 in relation to measurement of component 3 for one subject/on one treatment/on one day of fasting: Blue circles correspond to leptin and red squares to placebo. Increasing color intensity indicates more time (days) of fasting. d The ten parameters that compose components 1 and 3 and their level of contribution (loading) to the component. e Effects on metabolite and lipid metabolism of long-term leptin treatment in mildly hypoleptinemic women (placebo-controlled study 4, n = 19 (leptin = 10; placebo = 9)). Left: sPLS-DA analysis of metabolites and lipoproteins in placebo vs leptin. Symbols indicate the measurement of component 1 in relation to component 2 for one subject/on one treatment/on one day of study: blue circles correspond to leptin and red squares to placebo. Increasing color intensity of symbol indicates more time (weeks) of study. Large oval-colored shapes indicate 95% confidence interval for each group. The observed major overlap between groups suggests no significant differences between placebo and leptin. Right: Evaluation of metabolites and lipoproteins with one-way ANOVA in placebo and leptin-treated subjects for up to 36 weeks. Each dot represents a parameter (blue dot = nonsignificant parameter, red = preset color for significant parameters but no such parameter was detected). NMR-based metabolomics were used to quantify amino acids, metabolites, and lipids bound to lipoproteins. GC/MS-EI was used to quantify fatty acid methyl esters. Le_0, Le_1 etc. indicate day 0 (baseline), 1 etc. of fasting + leptin. Pl_0, Pl_1 etc. indicate day 0 (baseline), 1 etc. of fasting + placebo. For metabolite nomenclature, see Supplementary Data 2.

