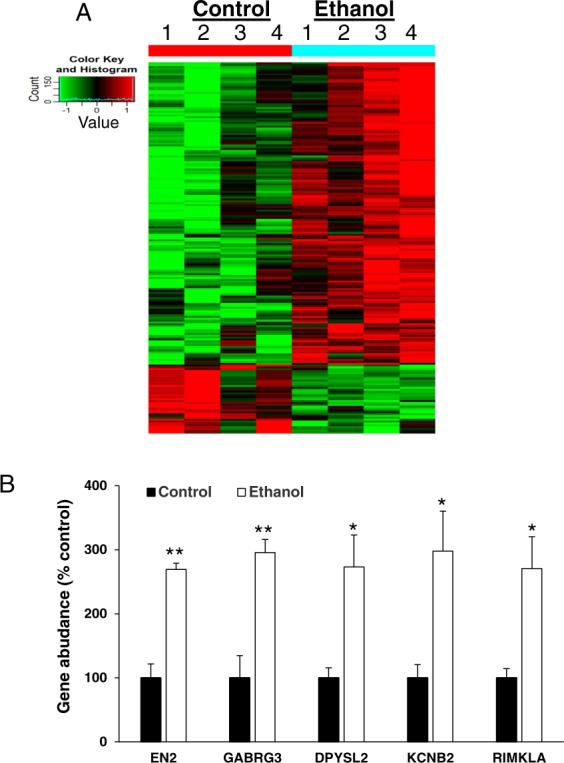
Fig. 5. Ethanol-induced abnormal gene expression profiles in iPSC-derived cerebral organoids.

A Differentially expressed genes between control and ethanol (230 mg/mL, 6 h)-treated cerebral organoids from iPSC line 1 are displayed as a heatmap. Green indicates relative lower expression levels of the genes and red indicates relative higher expression levels compared between control and ethanol groups (n = 4; P < 0.05). Supplemental Table 1 includes abnormally expressed individual gene profiles. Supplemental Table 2 describes the reported roles of dysregulated genes in neurodevelopment, nervous system physiology, and neurodegeneration. B Reverse transcription-quantitative polymerase chain reaction (RT-qPCR) validation of five representative altered genes from array data. n = 4; **P < 0.01, *P < 0.05 vs. control group. EN2 engrailed homeobox 2, GABRG3 gamma-aminobutyric acid type A receptor gamma3 subunit, DPYSL2 dihydropyrimidinase like 2, KCNB2 potassium voltage-gated channel subfamily B member 2, RIMKLA ribosomal modification protein rimK like family member A.
