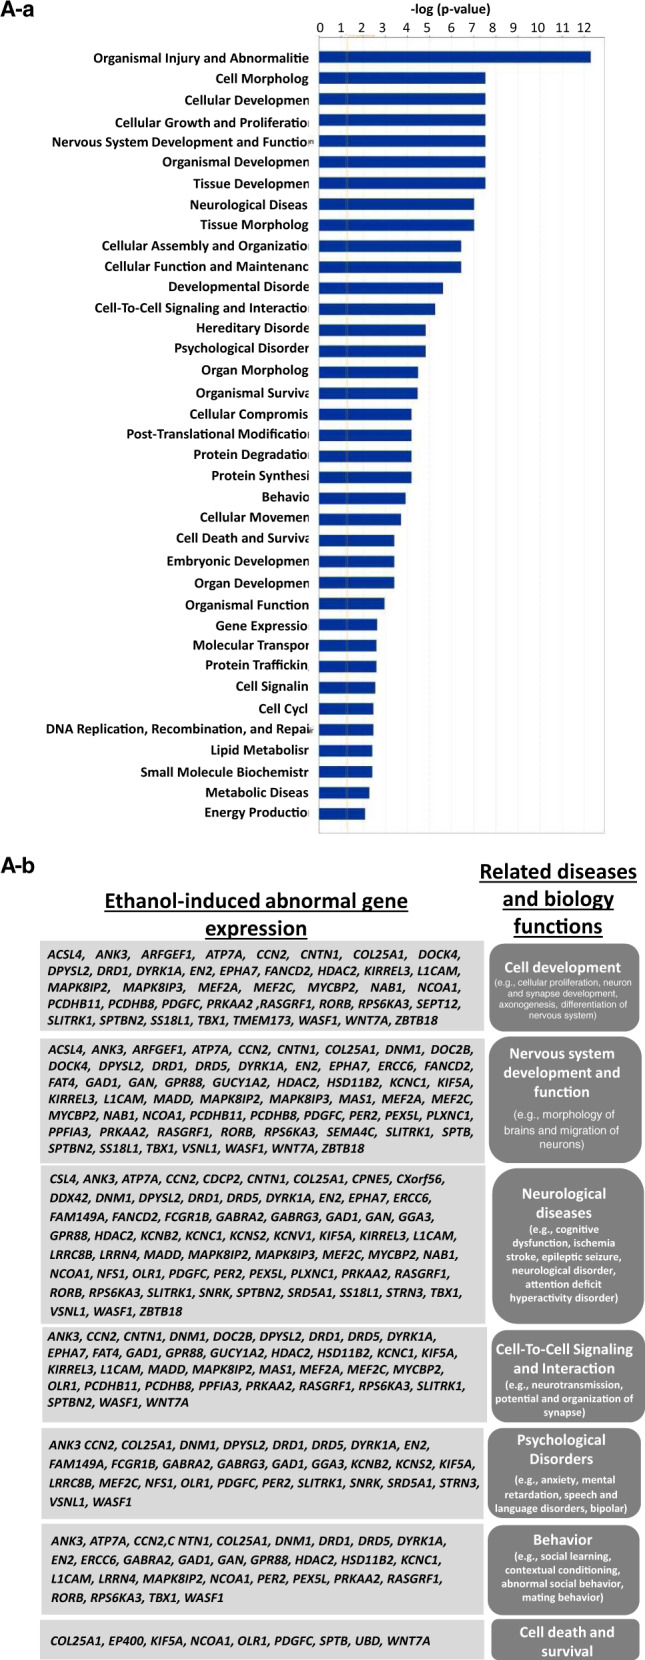
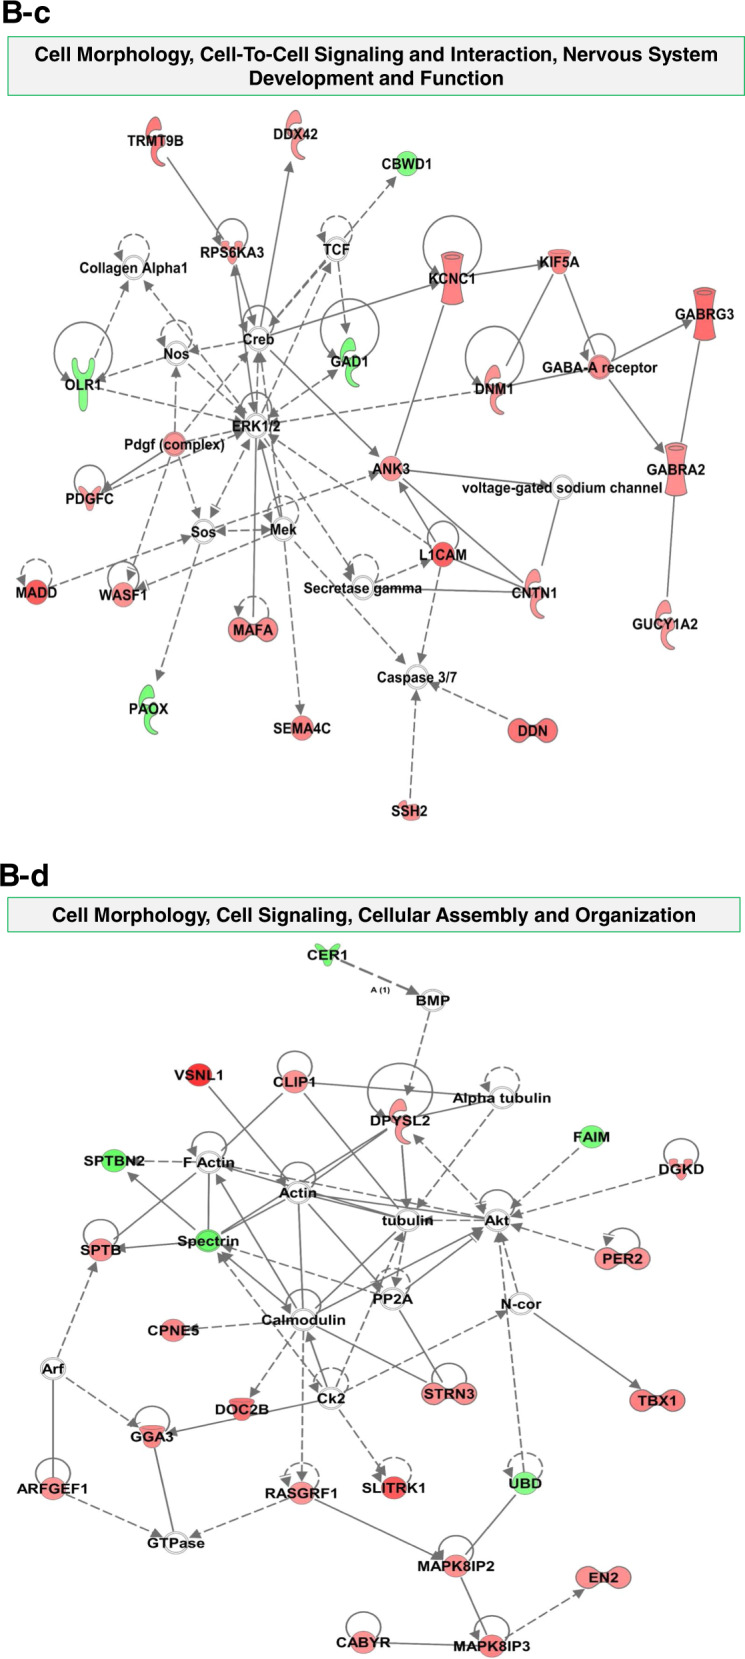
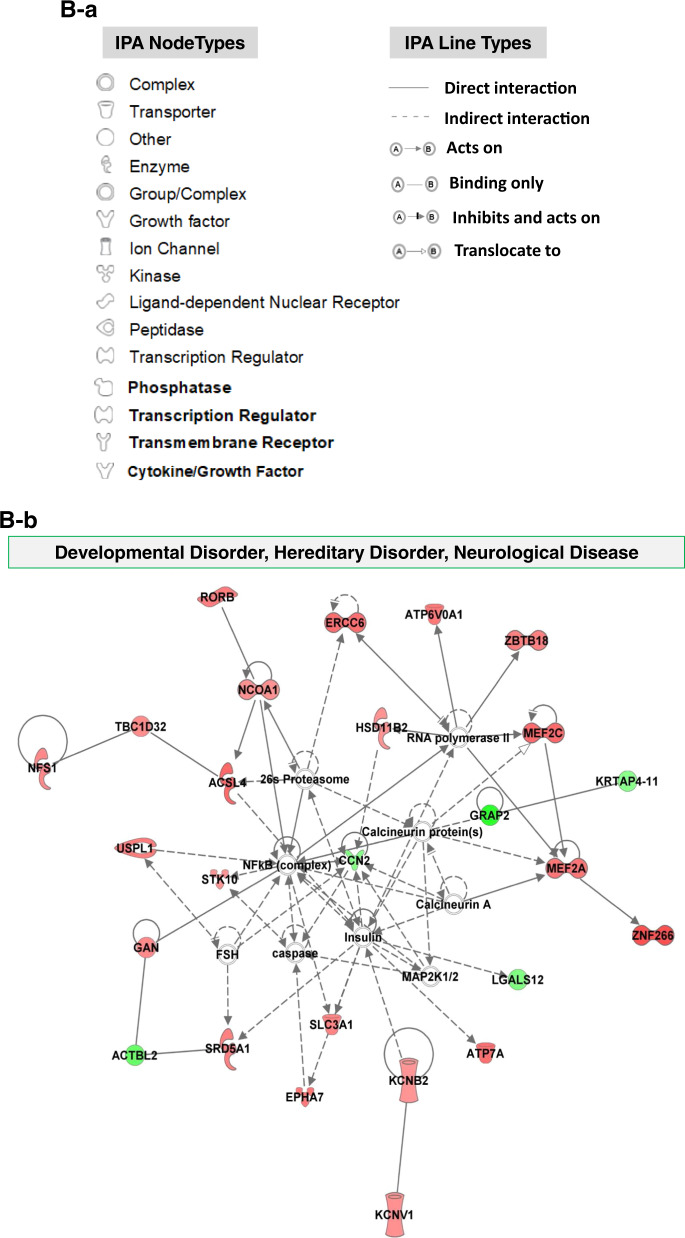
Fig. 6. Bioinformatics analysis of ethanol (230 mg/mL, 6 h)-induced altered gene-related signaling and networks in 2-month cerebral organoids from iPSC line 1 using Ingenuity Pathway Analysis (IPA) software.


A Ethanol-induced abnormally expressed gene-related 37 diseases and biological functions (a), and representative 7 signaling networks (right column) that are associated with were associated with the development and neurodegenerative phenotypes and the corresponding dysregulated genes conferred by ethanol exposure (left column) (b). Supplemental Table 3 includes all abnormally expressed genes related to 37 diseases and function signaling shown in Fig. 6A-a. B Exploring the mechanistic networks of the ethanol-induced dysregulated genes by network analysis using IPA tools. (B-a) Defining various nodes and lines depicted in Figs. B-b to d. Each symbol represents one individual gene category such as enzyme and ion channel. Solid and dotted lines show a direct and indirect connection between genes. (B-b to c) The main associated functions of each network are as follows: developmental disorder, hereditary disorder, neurological disease (b); cell morphology, cell-to-cell Signaling, and interaction, nervous system development and function (c); and cell morphology, cell signaling, cellular assembly and organization (d). Gene names are shown on the network map. Green symbols indicate downregulation and red indicate upregulated genes in ethanol-treated 2-month cerebral organoids relative to control organoids. The abbreviations of the genes were defined in Supplemental Table 1.

