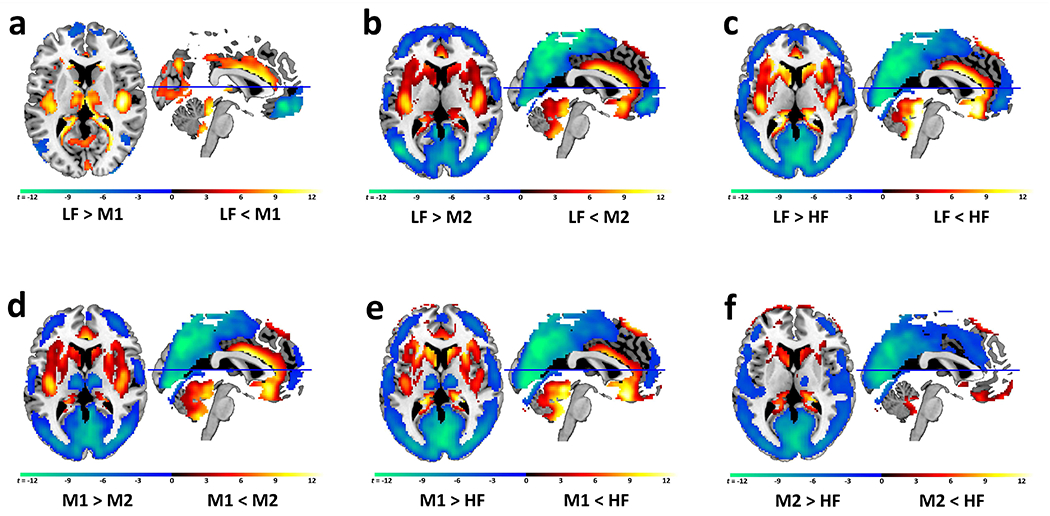
Figure 1. Brain ALFF distribution.

Subcortical and cortical frequency oscillation band preferences over all subjects independent of diagnosis.
Panels b, c, d, e: Cortical brain regions (green-blue) show higher ALFF values in the lower frequency (LF, M1) bands than in the higher frequency (M2, HF) bands, while subcortical brain regions (yellow-red) show higher ALFF values in the higher frequency (HF, M2) than the lower frequency (LF, M1) bands (panel b: LF versus M2; panel c: LF versus HF; panel d: M1 versus M2; panel e: M1 versus HF). Minor differences in ALFF power occurred among lower frequency bands, LF versus M1 (panel a), and among higher frequency bands, M2 versus HF (panel f). The thalamus is unique in that it shows higher ALFF values in the M1 frequency band than LF (panel a: M1>LF; yellow-red) and HF bands (panel d: M1>M2; panel e: M1>HF; green-blue).
Abbreviations: low frequency (LF) (0.01-0.027 Hz), middle frequency 1 (M1) (0.027-0.073 Hz), middle frequency 2 (M2) (0.073-0.17 Hz) and high frequency (HF) (0.17-0.25 Hz).
