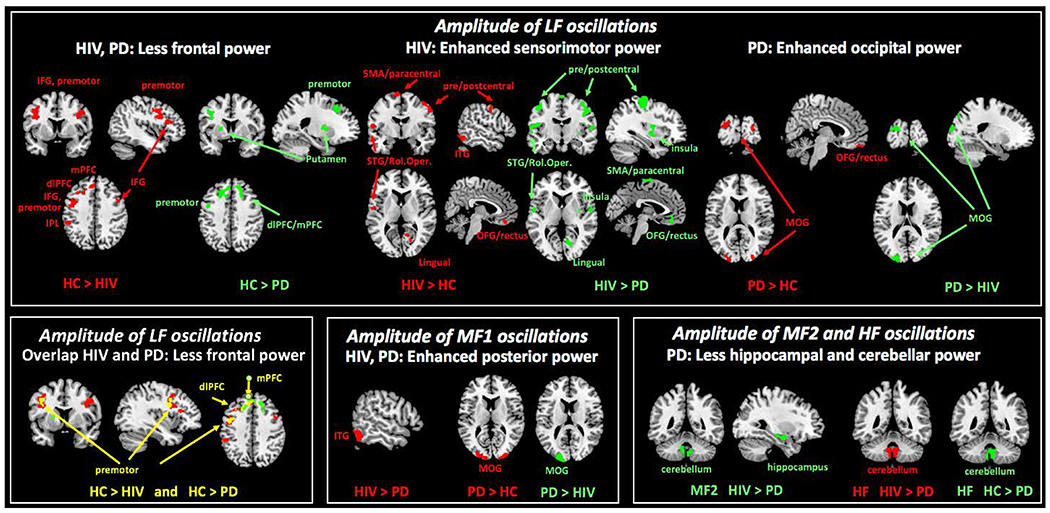
Figure 3. Study group comparison of whole brain ALFF values.

Results are depicted for paired group contrasts for each frequency band: lower frequency (LF; left panel), middle frequency (M1; upper right panel), and higher frequency bands (M2, HF; lower right panel). Full-factorial model in SPM12 with the between-subjects factor study groups by diagnosis (PD, HIV, HC), within-subject factor frequency band (LF, M1, M2, HF), and age and motion as covariates. Cluster significance threshold was set at p<0.05 corrected for multiple comparisons.
Abbreviations: Study groups by diagnosis: Healthy control (HC) group, HIV infection (HIV) group, Parkinson’s disease (PD) group; oscillation frequency bands: low frequency (LF), middle frequency 1 (M1), middle frequency 2 (M2), high frequency (HF).
