
Figure 1.
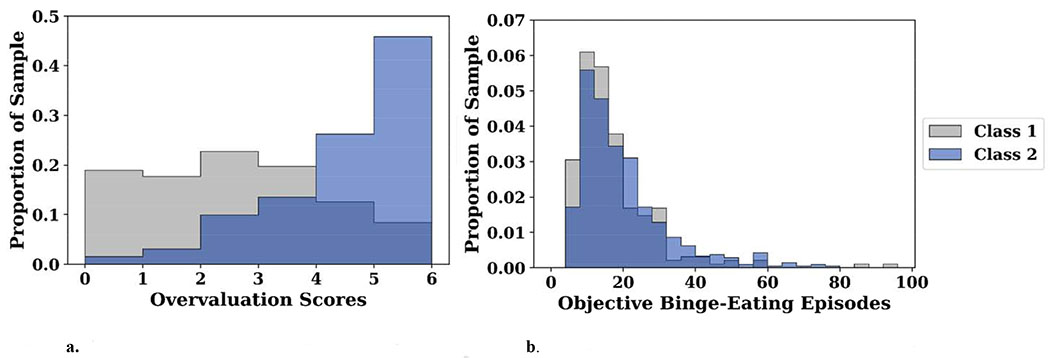
a. Distribution of Overvaluation Scores by Class. b. Distribution of Objective Binge-Eating Scores by Class.
The two classes are indicated by color, and the histograms plot the proportion of each class scoring in a given range. The darkest shading indcates overlap between the classes. That is, the proportion common to both classes scoring within that range. In Fig. 1a the data demonstrate significant seperation between classes with respect to the central tendecy as well as the overall distribution. In Fig. 1b, the data demonstrate significant overlap between classes.