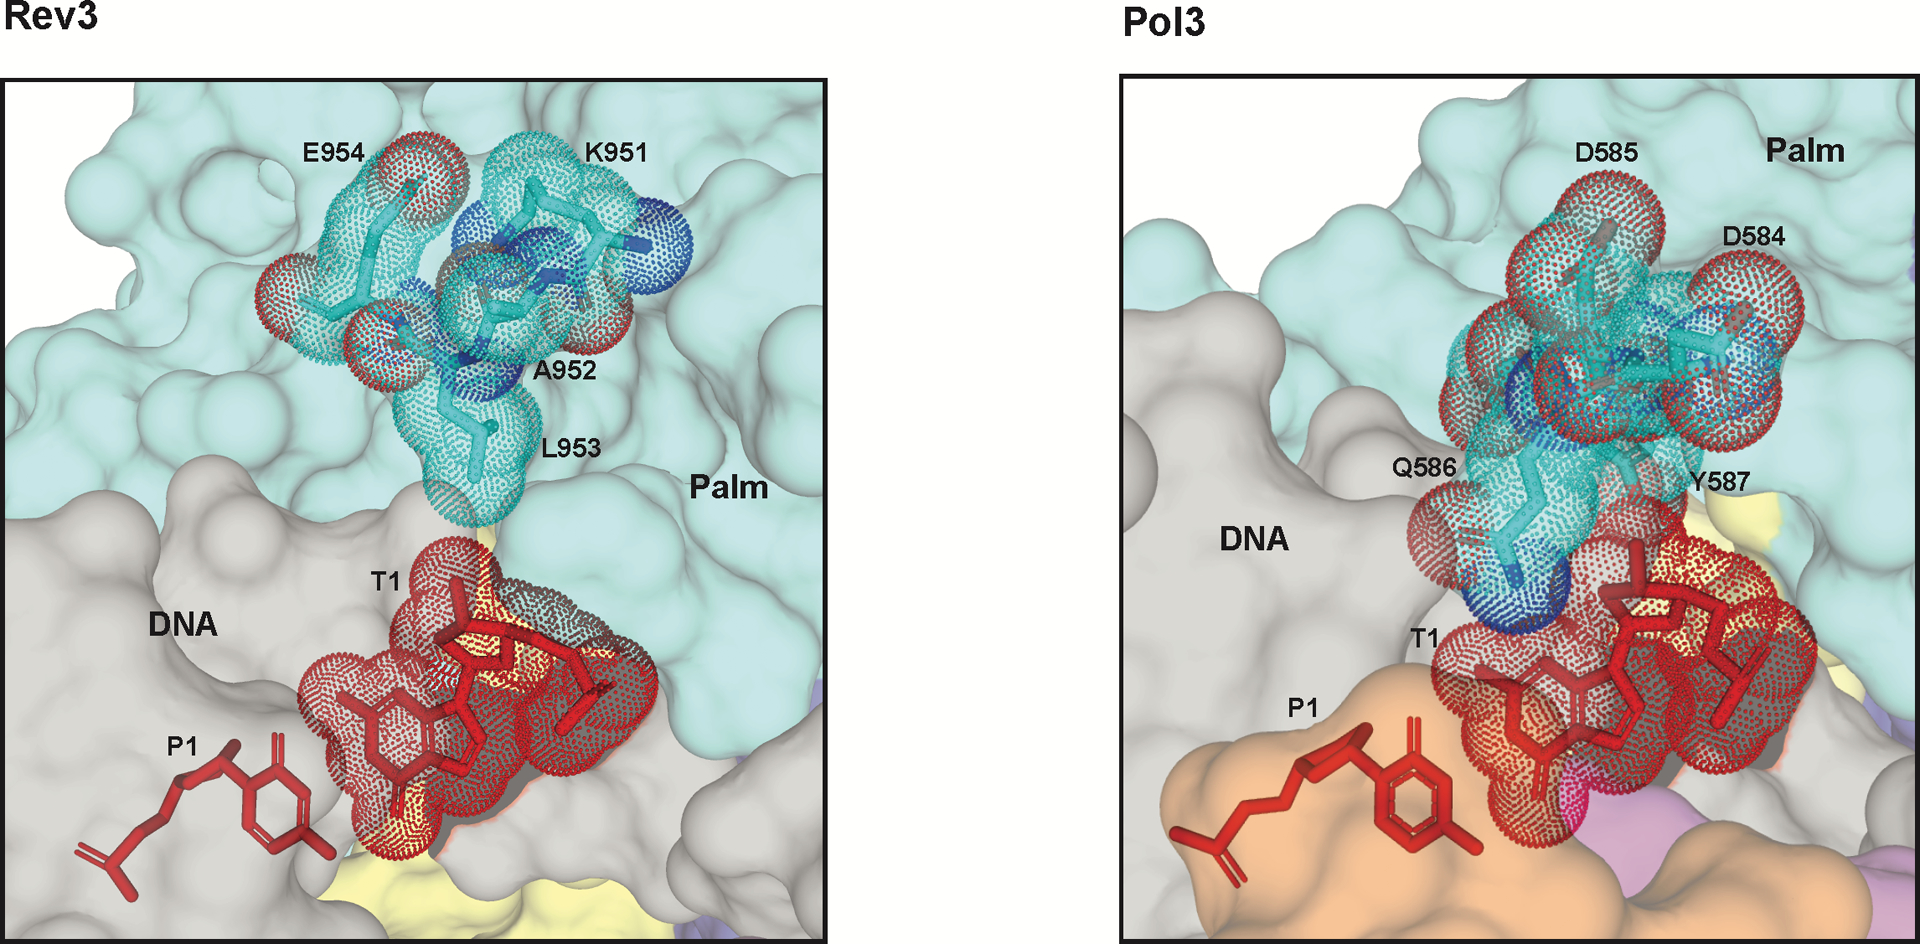
Extended Data Fig. 5. Surface representation of the T1 binding site.

Residues around the T1 site are shown (sticks) for Rev3 (left) and Pol3 (right). Surface for the palm domains and DNA are shown in cyan and grey, respectively. The T1 base (red) and the key residues are highlighted in dots..
