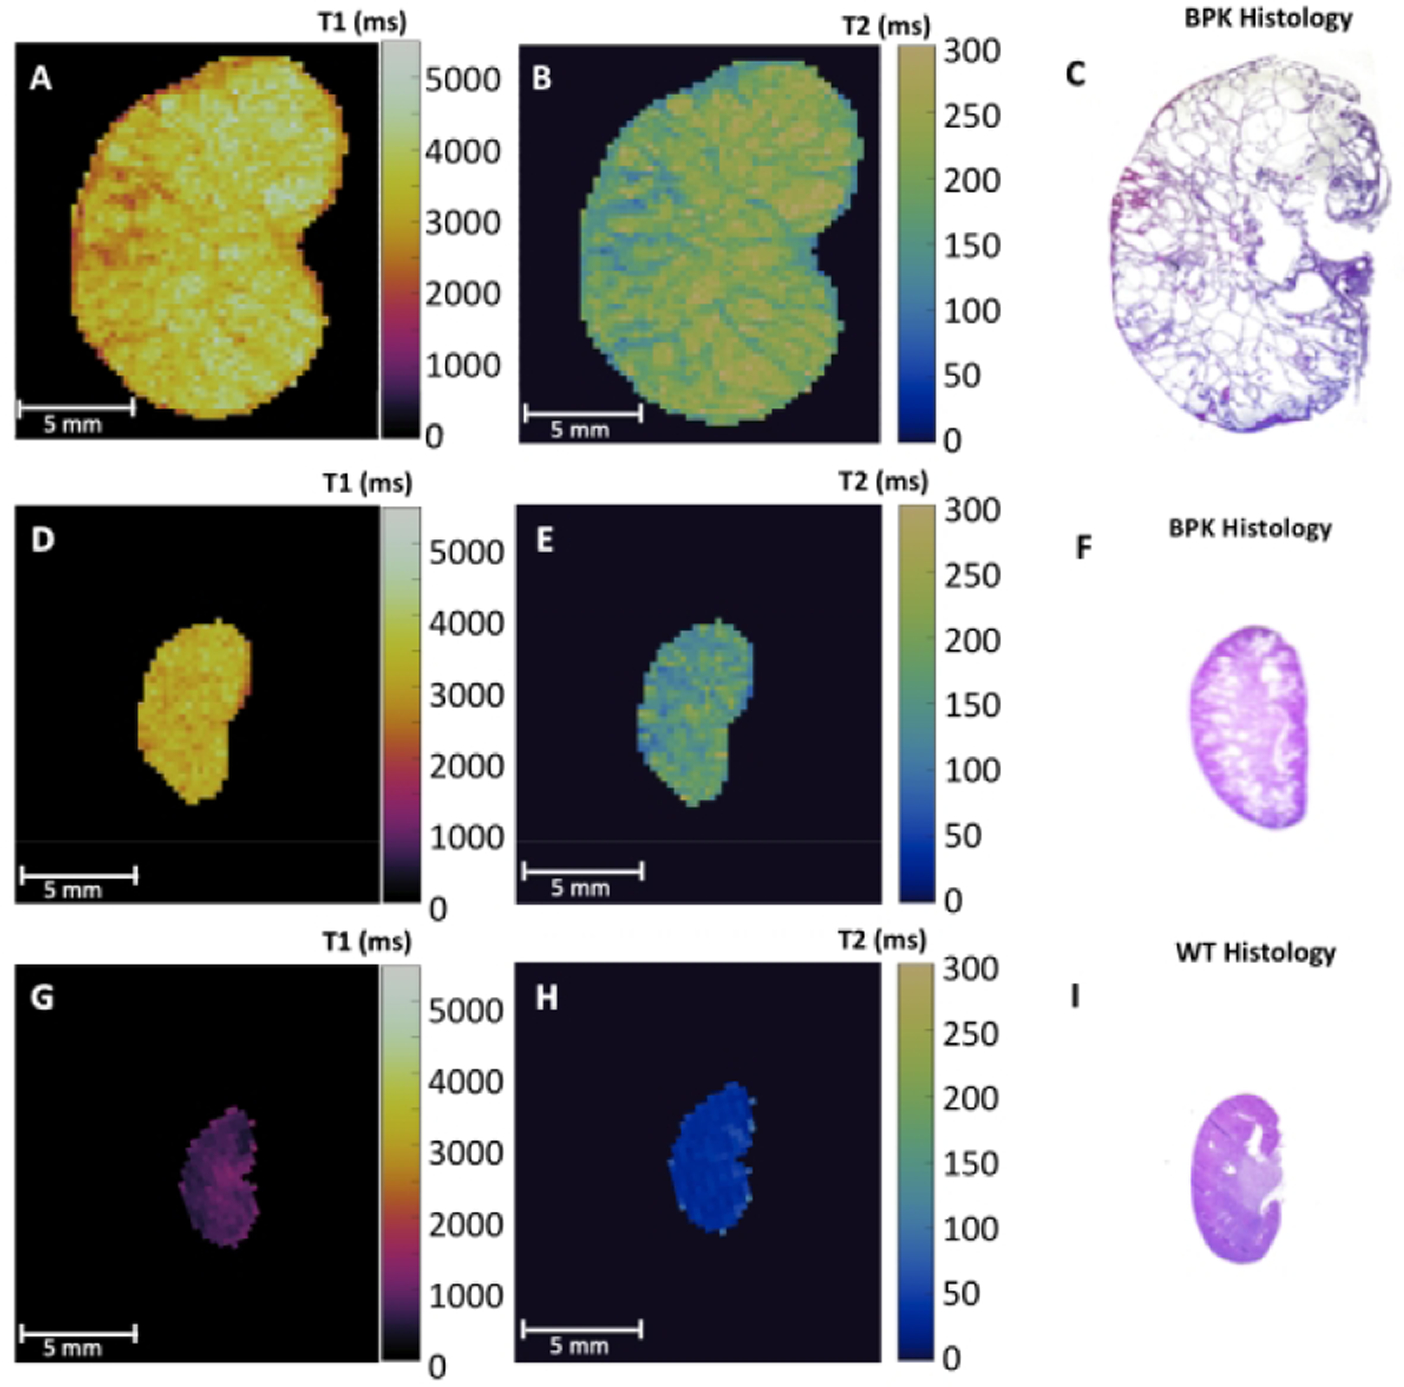
Figure 1:

Representative ex vivo T1 and T2 relaxation time maps and corresponding H&E stained sections of (A,B,C) 18-day-old bpk mouse kidney, (D,E,F) 8-day-old bpk mouse kidney, and (G,H,I) 18-day-old WT mouse kidney. Note the visibly increased renal T1 and T2 values for the bpk kidneys over time in comparison to the WT kidney.
