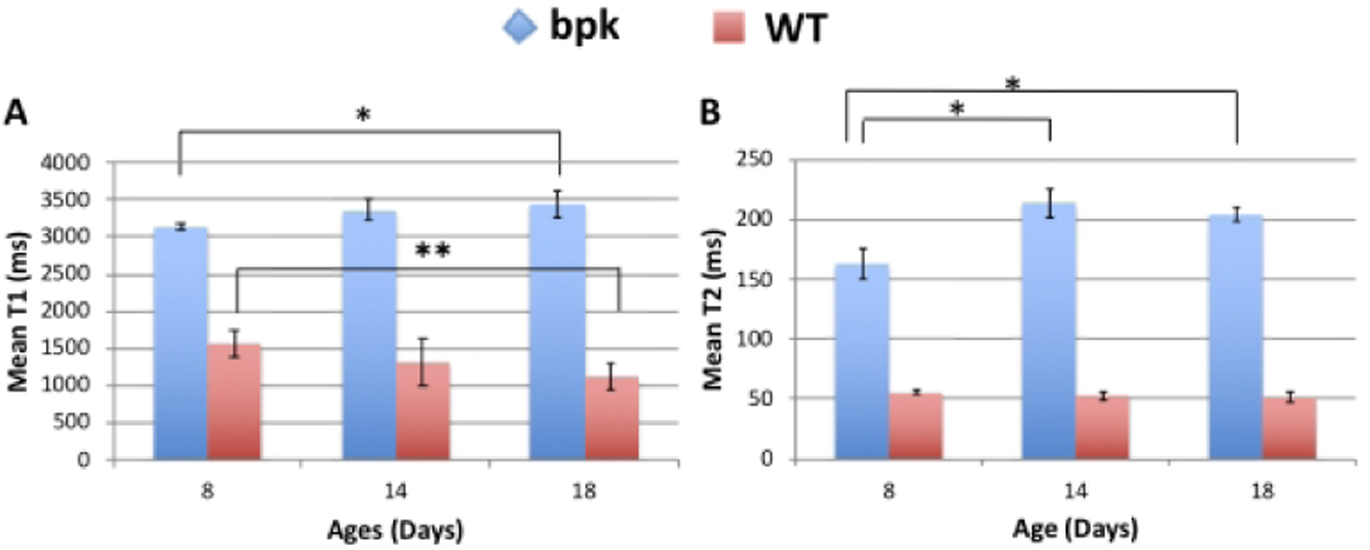
Figure 2:

Comparison of mean renal A) T1 and B) T2 relaxation time for bpk and WT mice at 8 days, 14 days, 18 days of age. Bpk mouse kidneys exhibit progressive increases in T1 and T2 with age (*p<0.02). In contrast, WT mice show no change in T2 and a reduction in T1 with age (**p=0.03). Mean renal T1 and T2 values were also significantly increased for bpk mice in comparison to WT control mice at all ages (p < 2 × 10⁻¹⁰).
