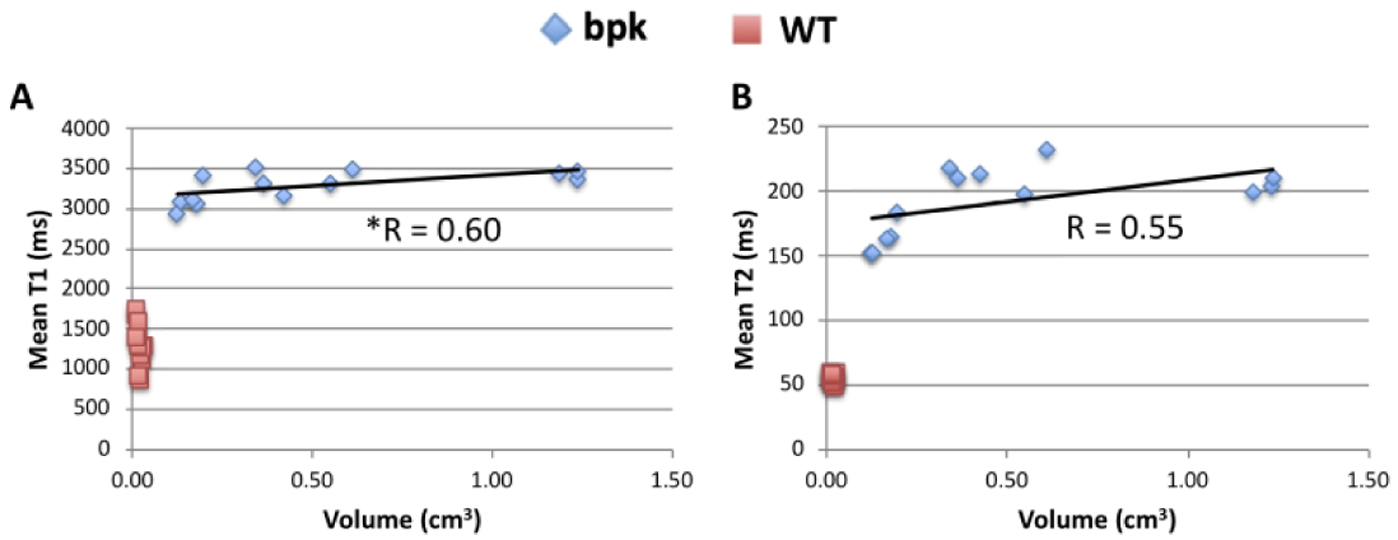
Figure 3:

Scatterplots of mean renal A) T1 and B) T2 relaxation time for bpk mice and WT mice as a function of total kidney volume. Mean renal T1 (R=0.60, *p=0.030) and T2 (R=0.55, p=0.054) show significant (T1) or nearly significant (T2) correlations with kidney volume. No significant correlations were observed for the WT mice.
