
Figure 3.
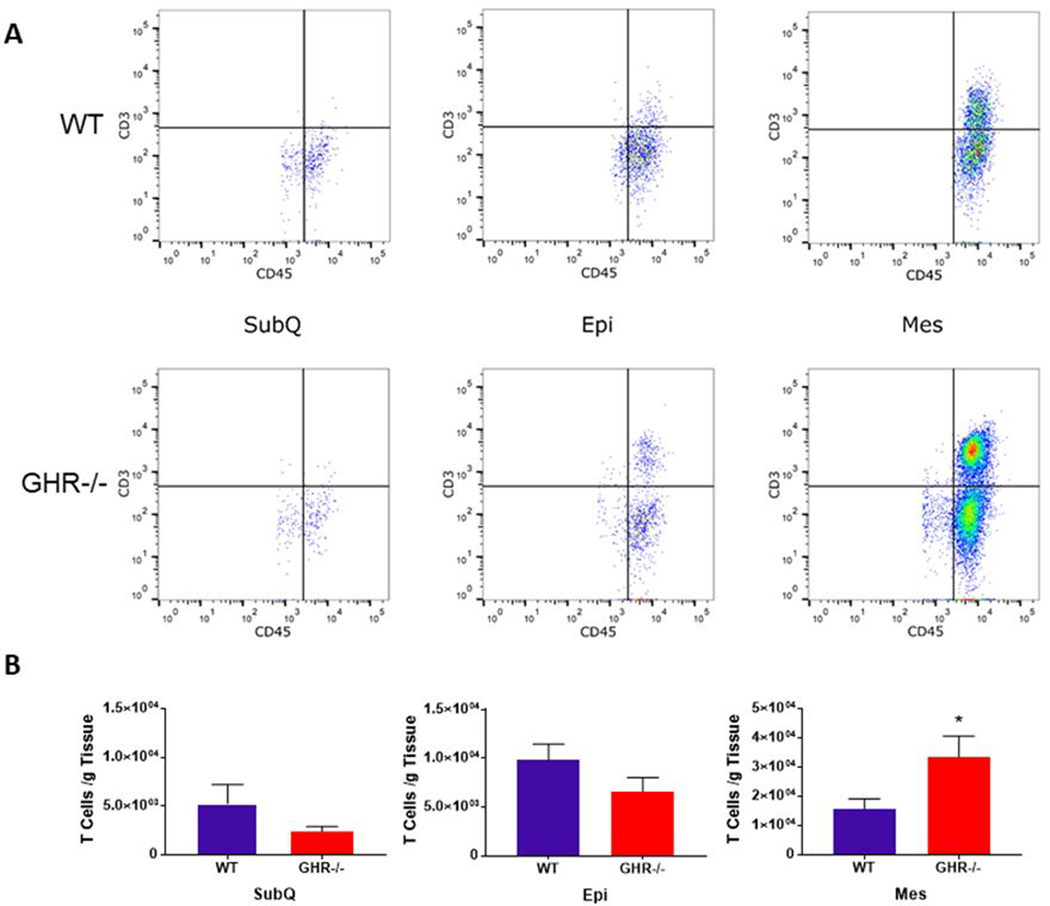
Quantification of adipose tissue T cells in WT and GHR−/− WAT depots at 8 months of age. A. Dot plot distribution of T cells (CD3+ CD45+) in WT and GHR−/− male mice. The y-axis and x-axis of the dot plots represent fluorescent intensity. B. Number of CD3+CD45+ T cells normalized to depot weight in WT and GHR−/− male mice: SubQ p=0.4634, U=21; Epi p=0.1304, U=17; Mes p=0.0281, U=11. Data are expressed as mean ± SEM. WT n = 8 and GHR−/− n = 8. * indicates a significant difference; p < 0.05