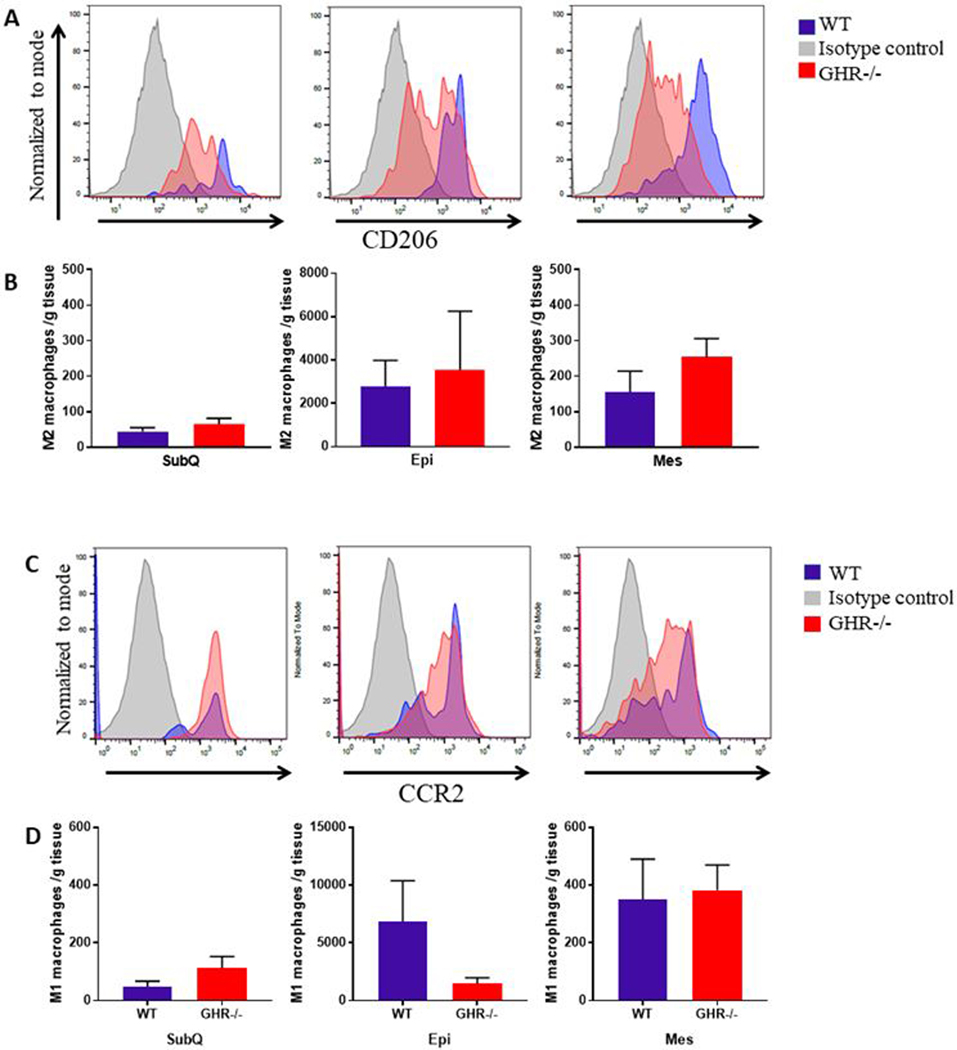
Figure 5.

Comparisons of M2 and M1 populations in WT and GHR−/− mice at 8 months of age. A and C. Distribution and quantification of M2 macrophages (A) and M1 macrophages (C) in WT and GHR−/− male mice. The y-axis represents relative number of events normalized to mode and the x-axis represents the intensity of the fluorescent signal. Isotype control, WT and GHR−/− are represented by gray, blue and red peaks respectively. B and D. Distribution and quantification of M2 macrophages (B: SubQ p=0.28, t=1.127, df=13; Epi p=0.3823, U=23; Mes p=0.1605, U=18) and M1 macrophages (D: SubQ p=0.2319, U=17; Epi p=0.1944, U=19; Mes p=0.3823, U=23) in WT and GHR−/− male mice. M2 and M1 populations were derived from F480+CD11b+CD45+ ATM parent population. It should be noted that because cells over a certain fluorescence threshold were counted, the variation in intensity of the fluorescence shown in A and C is not reflected in the enumeration of cells reported in B and D. Data are reported as the mean of the number of cells per gram of tissue ± SEM.
