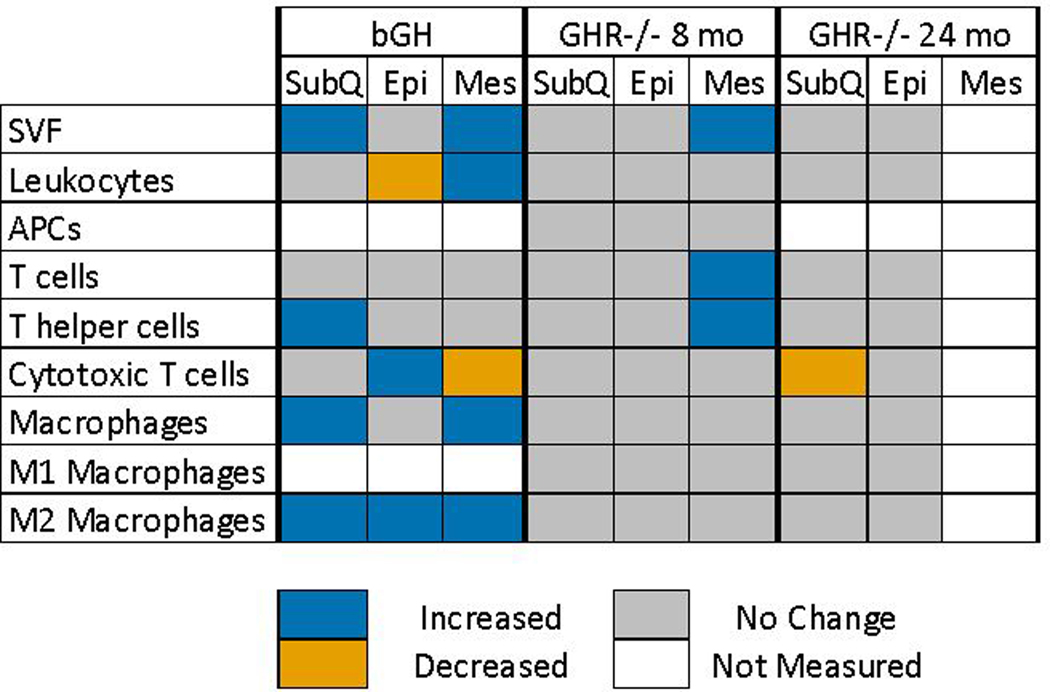
Figure 8.

Summary of flow cytometry results. The flow cytometry results of three different cohorts of GH-altered mice (bGH(16), GHR−/− 8 months, and GHR−/− 24 months) are summarized in this figure. A significant increase is indicated by a blue cell, significant decrease an orange cell, no significant change is indicated by a grey cell and no measurement is a signified by a white cell.
