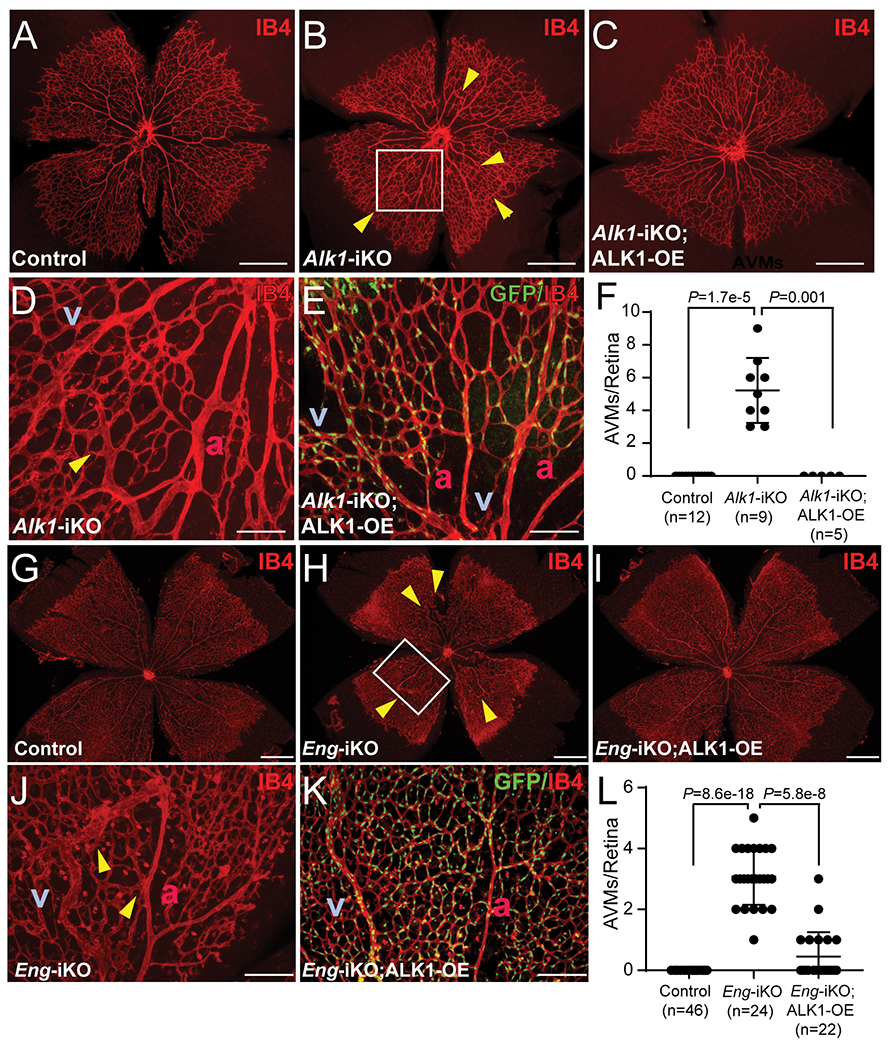
Figure 3. ALK1-OE in retinal ECs suppresses the development of AVMs caused by ALK1- or ENG-deficiency.

A-E, IB4 staining of postnatal day 5 (PN5) retinas from control (A, n=12), SclCreER;Alk1-iKO (B and D, n=9), and SclCreER;Alk1-iKO;ALK1-OE (C and E, n=5) mice. The boxed region in B is a magnified image showing direct connections between arteries and veins (D). SclCreER-mediated GFP reporter expression in SclCreER;Alk1-iKO;ALK1-OE retinas (E). F, Quantification of AVM numbers in PN5 retinal vasculature. Kruskal–Wallis test with Dunn’s correction. G-K, IB4 staining of PN7 retinas from control (G, n=46), SclCreER;Eng-iKO (H and J, n=24), and SclCreER;Eng-iKO;ALK1-OE (I and K, n=22) mice. The boxed region in H is a magnified image showing arteriovenous shunts (J). Bicistronic GFP reporter expression in SclCreER;Eng-iKO;ALK1-OE retinas (K). L, Quantification of the number of AVMs. Yellow arrowheads indicate AVMs in the developing retinas. Kruskal–Wallis test with Dunn’s correction. All data are means ± SDs. a, artery; v, vein. Scale bars: A-C and G-I, 500 μm; D, E, J, and K, 100 μm.
