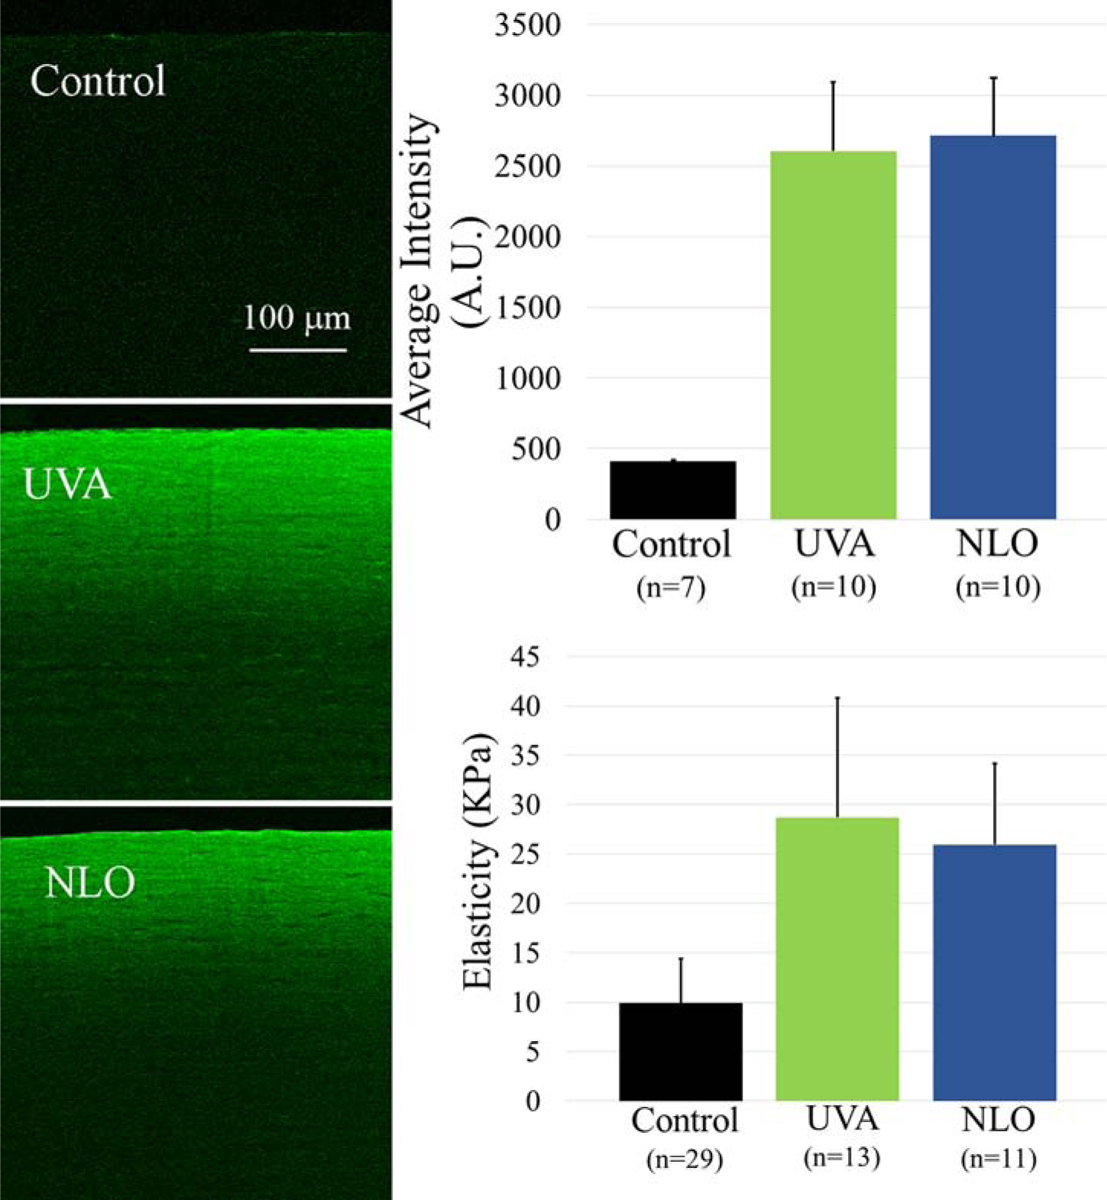
Figure 3: CAF Intensity and Mechanical Stiffening.

To the left are representative CAF images of control, UVA CXL, and NLO CXL treated corneas respectively. To the right are graphs showing the significanly increased CAF intensity and elasticity of corneas treated with either crosslinking method which are not significanly different from each other. CAF was detected in the 400–450 nm range, but images are shown in green to enhance contrast.
