
Extended Data Figure 2. Structural comparison of hSTAT2 and hSTAT1.
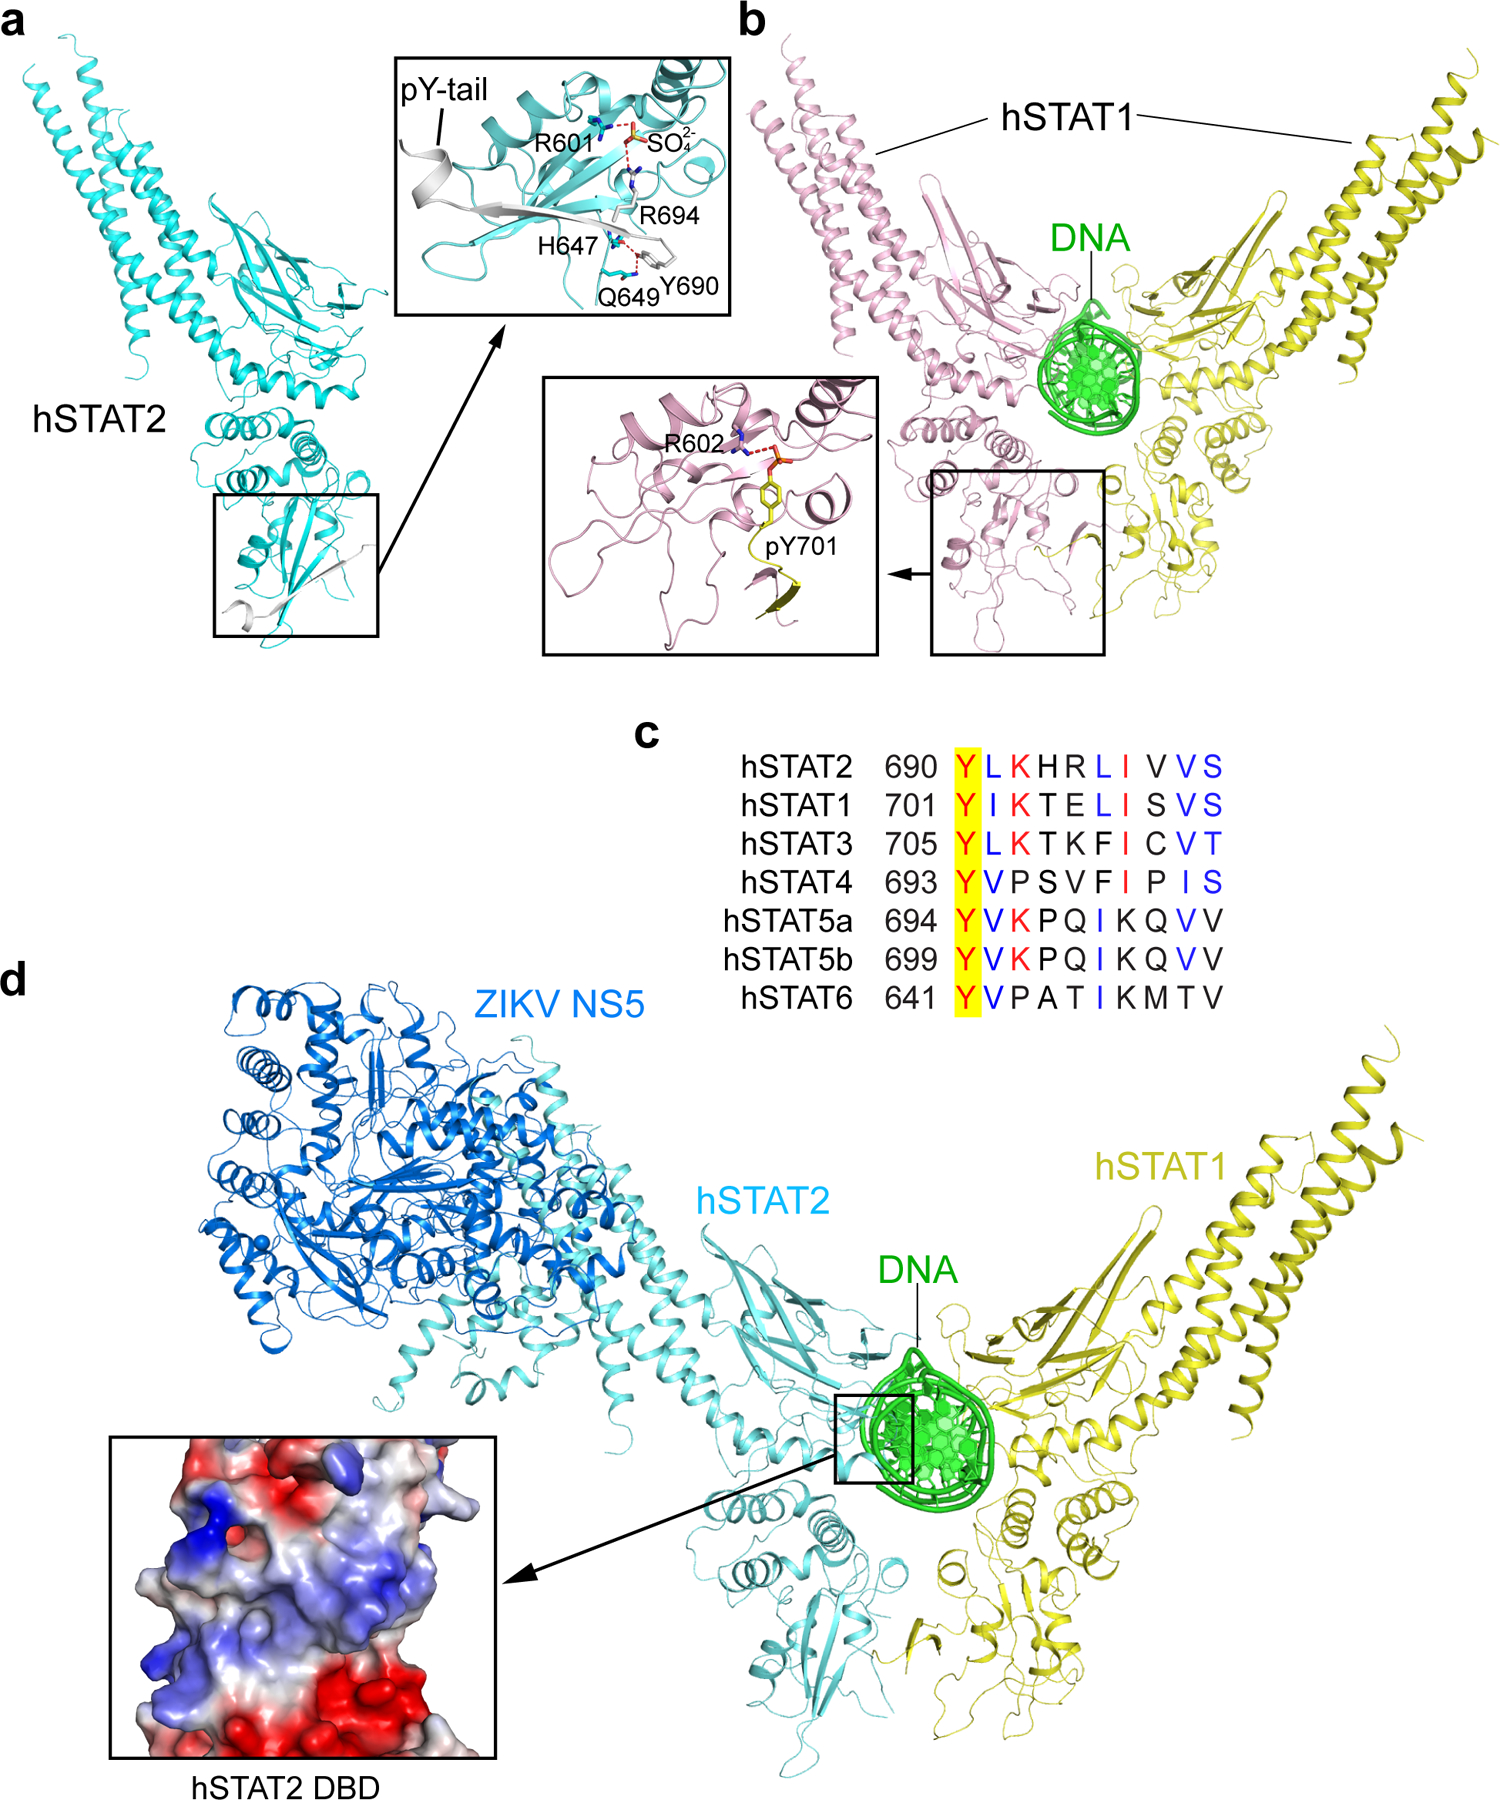
a, Ribbon representations of the CF of hSTAT2 (cyan) in association with its pY-tail segment (grey). The intramolecular interaction between the SH2 domain and the unphosphorylated pY-tail segment of hSTAT2 is highlighted in the expanded view. The hydrogen bonds are depicted as dashed lines. b, Ribbon representation of homodimeric hSTAT1 in complex with DNA, with the intermolecular interaction between the hSTAT1 SH2 domain (light pink) and the phosphorylated pY-tail segment from the other monomer (yellow) of the hSTAT1 homodimer shown in the expanded view. c, Sequence alignment of the pY-tail segments of human STAT proteins. Identical and similar residues are marked in red and blue, respectively. The target tyrosine is shaded in yellow. d, Structural model of the ZIKV NS5–hSTAT2–hSTAT1–DNA complex, with the surface electrostatic view of the hSTAT2 DBD shown in the expanded view.