
Extended Data Figure 3. Cryo-EM analysis of the ZIKV NS5–hSTAT2 complex.
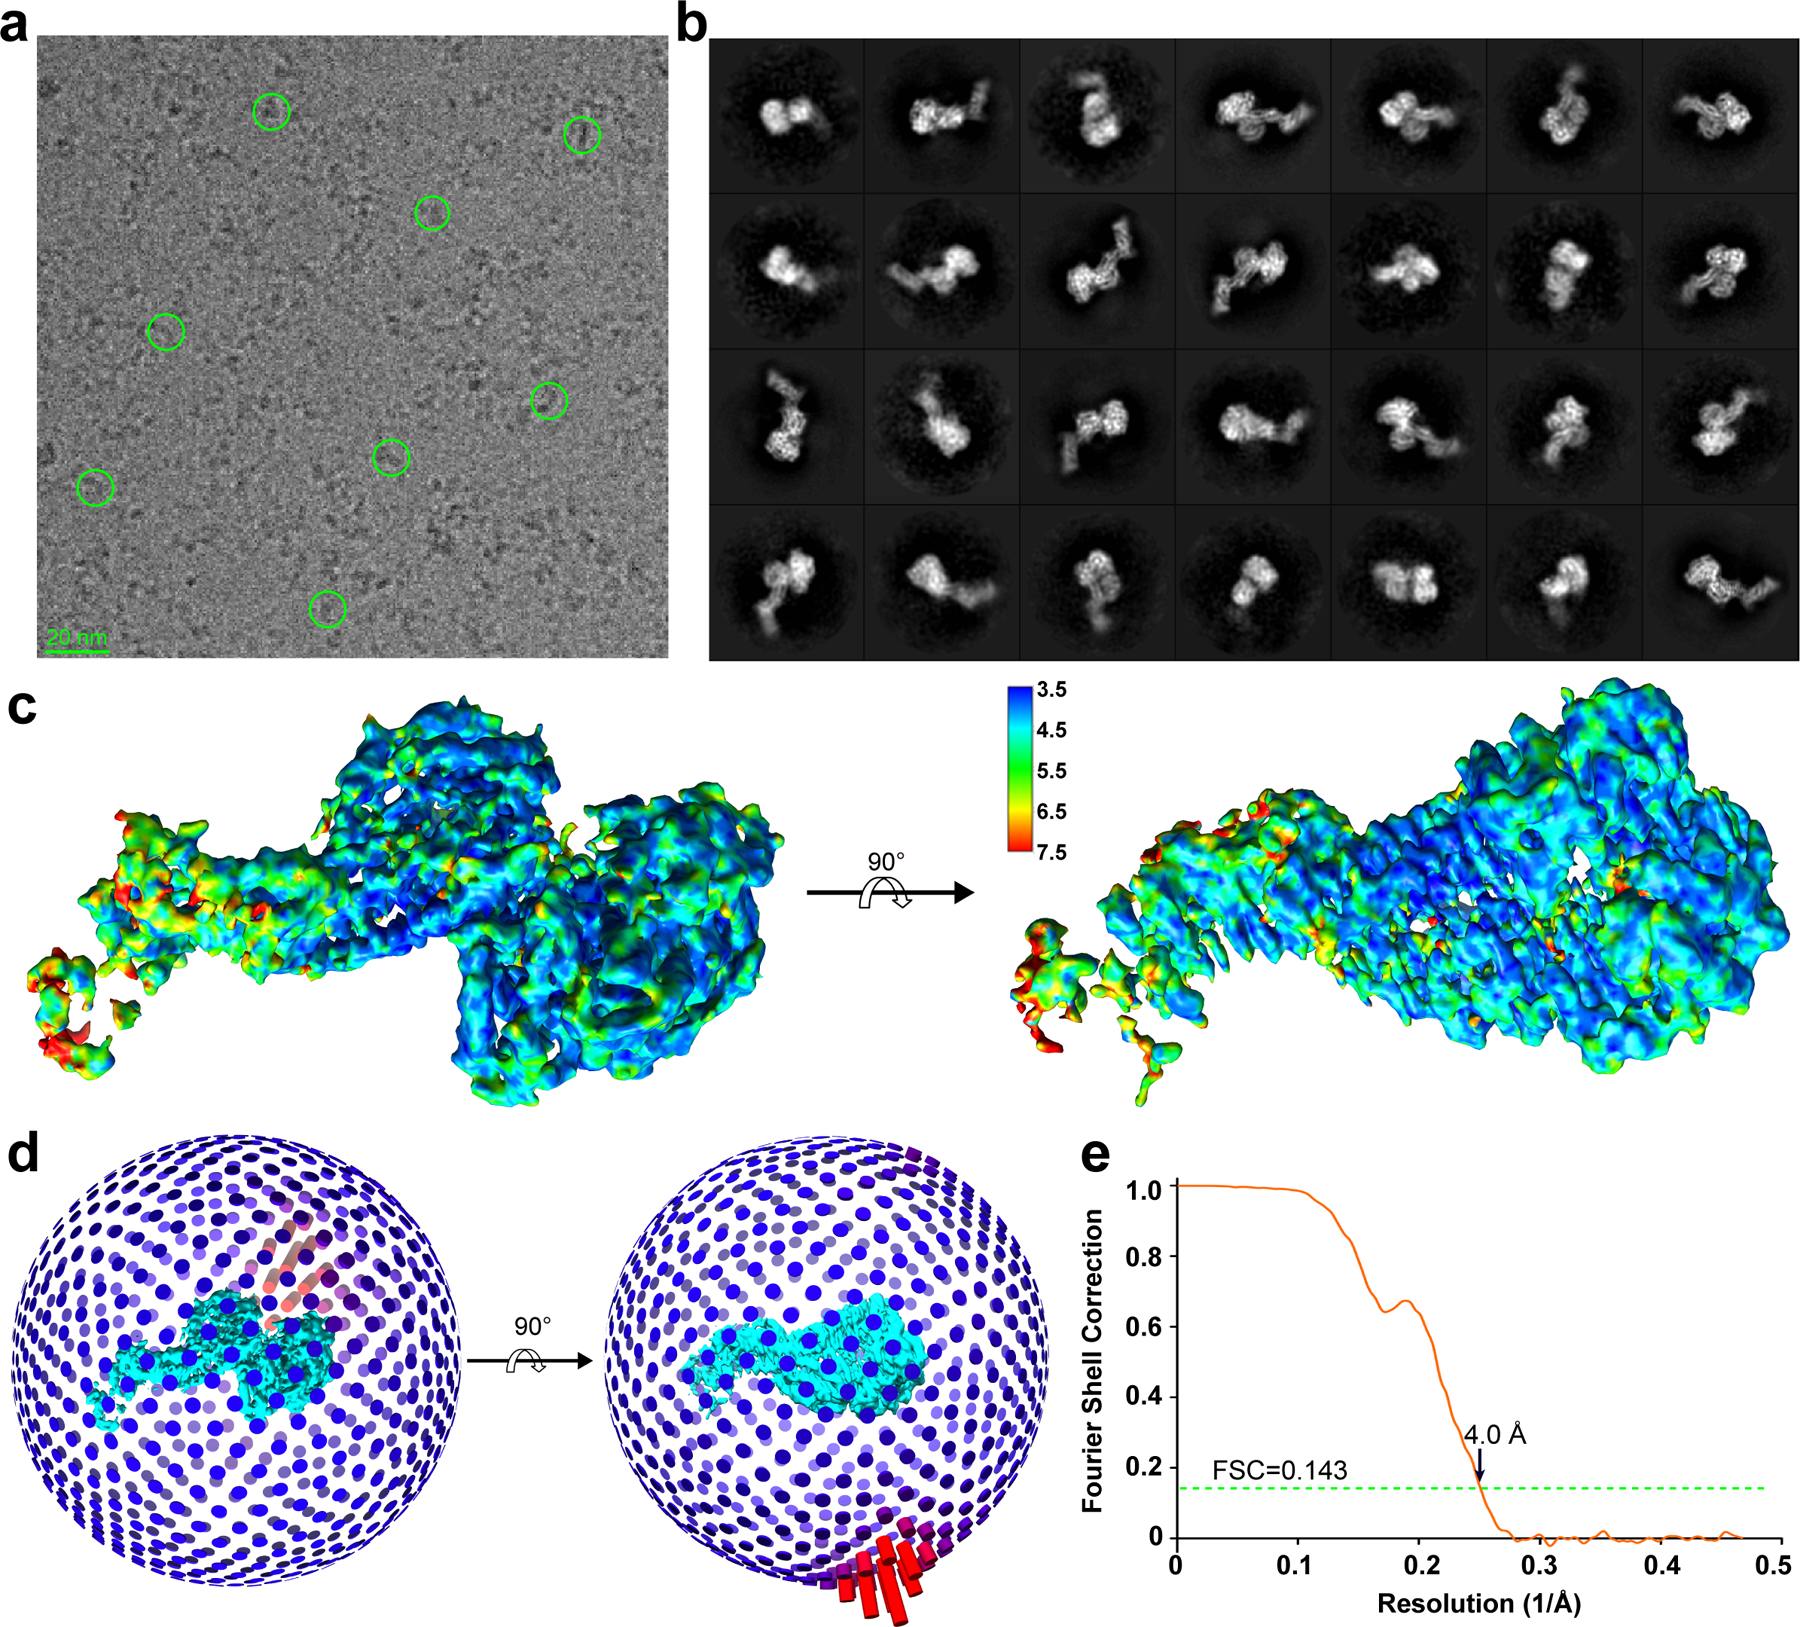
a, A representative cryo-EM micrograph with select particles circled. b, 2D class averages used to generate the model. c, Local resolution evaluation of the reconstructed map by Resmap. d,e, Angular distribution (d) and global resolution evaluation based on “gold-standard” Fourier shell correction (FSC) (e), both generated by RELION.