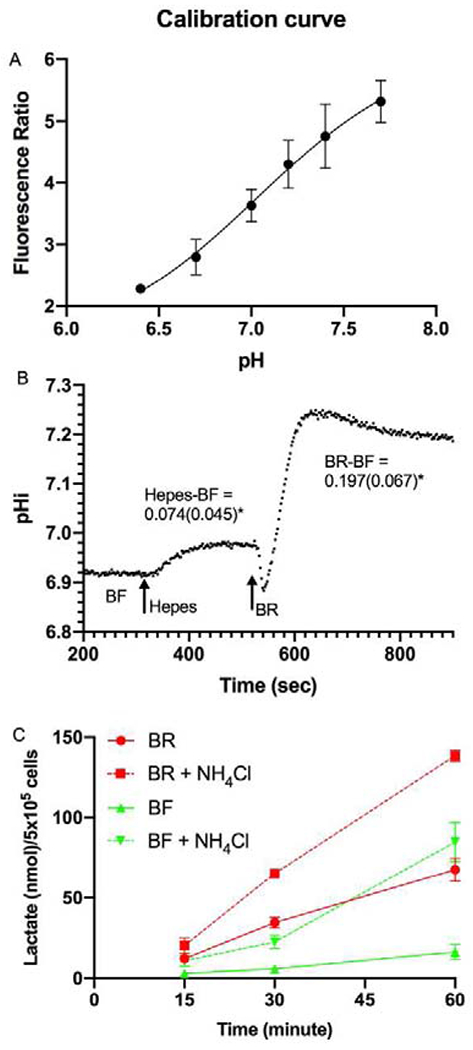
Figure 3.

Intracellular pH. A) Standard High [K] plus Nigericin (K+/H+ exchanger) calibration of fluorescence emission ratio (Ex495/Ex440) vs pH, n=5 per data point. B) Representative trace of pHi of BCEC while perfused with BF, then HEPES, and then BR at arrows. Average (SD) of paired pHi differences (n=5) in HEPES and BR vs BF is shown. C) Lactate production in BF and BR in the presence of 15 mM NH4Cl, all at pH 7.5, n=3 per data point.
