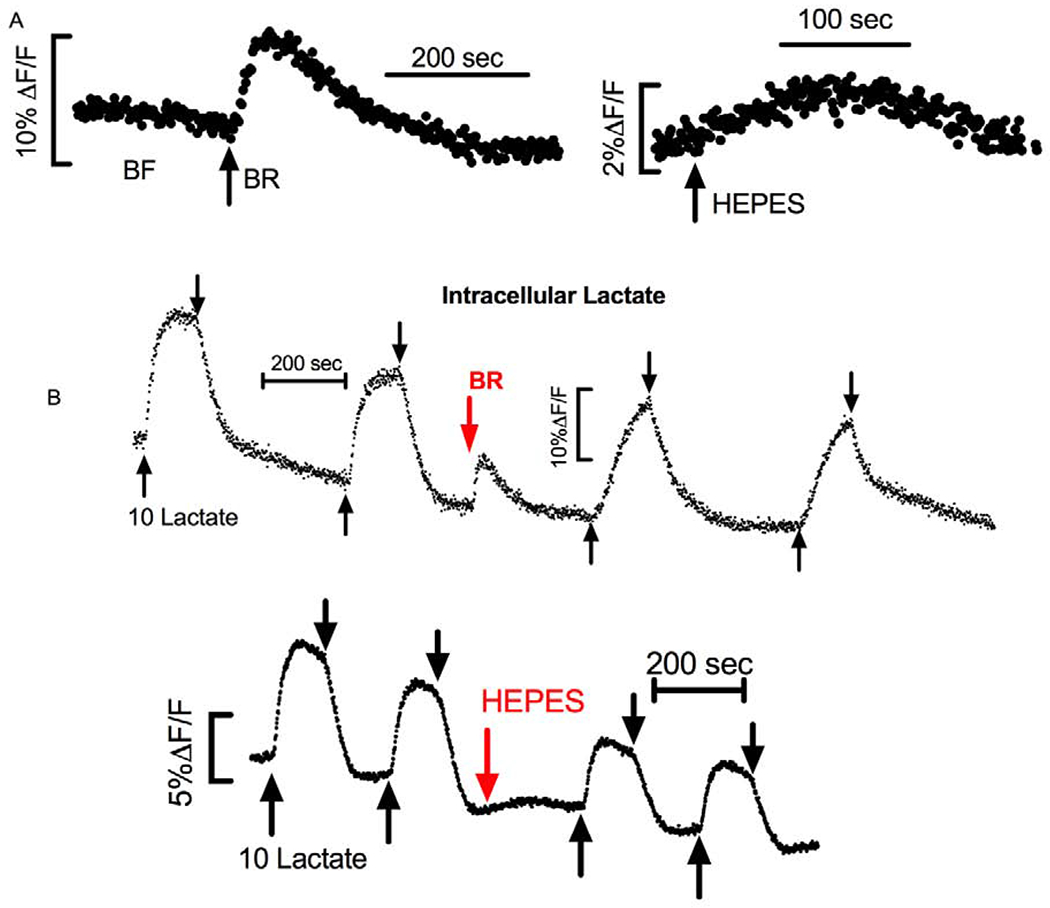
Figure 4.

Relative Changes in Intracellular [Lactate] Measured with Laconic. A) Representative trace of Laconic transfected BCEC perfused with BF and then switched to BR at the arrow (Left) or switched to HEPES (right). B) Laconic transfected cells exposed to 2-minute pulse of 10 mM lactate (between up arrow and down arrow) in BF and then BR (top trace), and BF and then HEPES (bottom trace).
