
Figure 4.
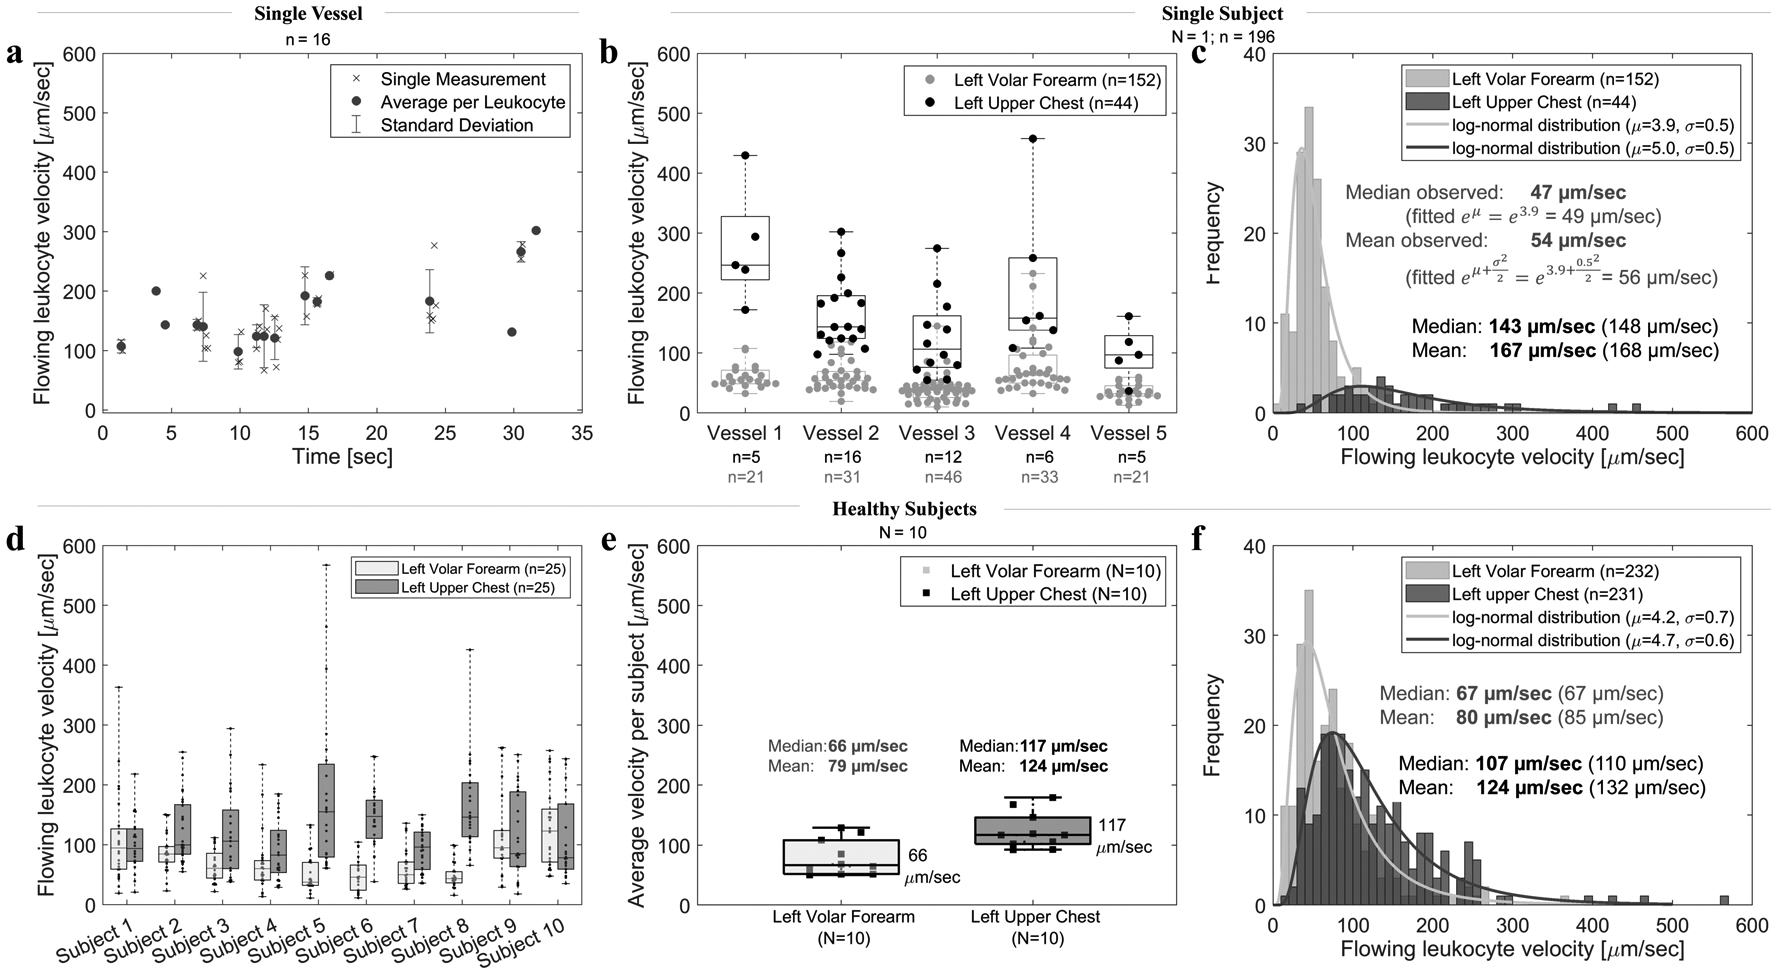
Flowing leukocyte velocity variations. (a) Variation within a single chest vessel (vessel 2) over the course of 30 seconds. Average velocity per leukocyte was calculated from 2–5 single measurements (represented by x) of the same leukocyte in consecutive frames. (b) Variation among 5 nearby vessels within the same 8×8 mm2 imaging area of subject 5. Each dot represents average velocity of a single leukocyte. (c) A histogram of all leukocyte velocities in the forearm and chest of a single subject (subject 5); median and mean velocity values of all measurements (observed) and calculated from the fitted log-normal distribution (in brackets). (d) Variation among 10 healthy subjects. Each dot represents a single leukocyte. Velocities of 5 leukocytes in 5 vessels per site were evaluated, resulting in 25 velocities per site per subject. (e) Variation among mean and median velocity per all subjects. Each square represents the average velocity per subject (N=10). (f) A histogram of all measured leukocyte velocities (n=232 in the forearm, n=231 in the chest) in all 10 healthy subjects. Note that in all graphs N represents the number of subjects (squares), whereas n represents the number of leukocytes (dots).