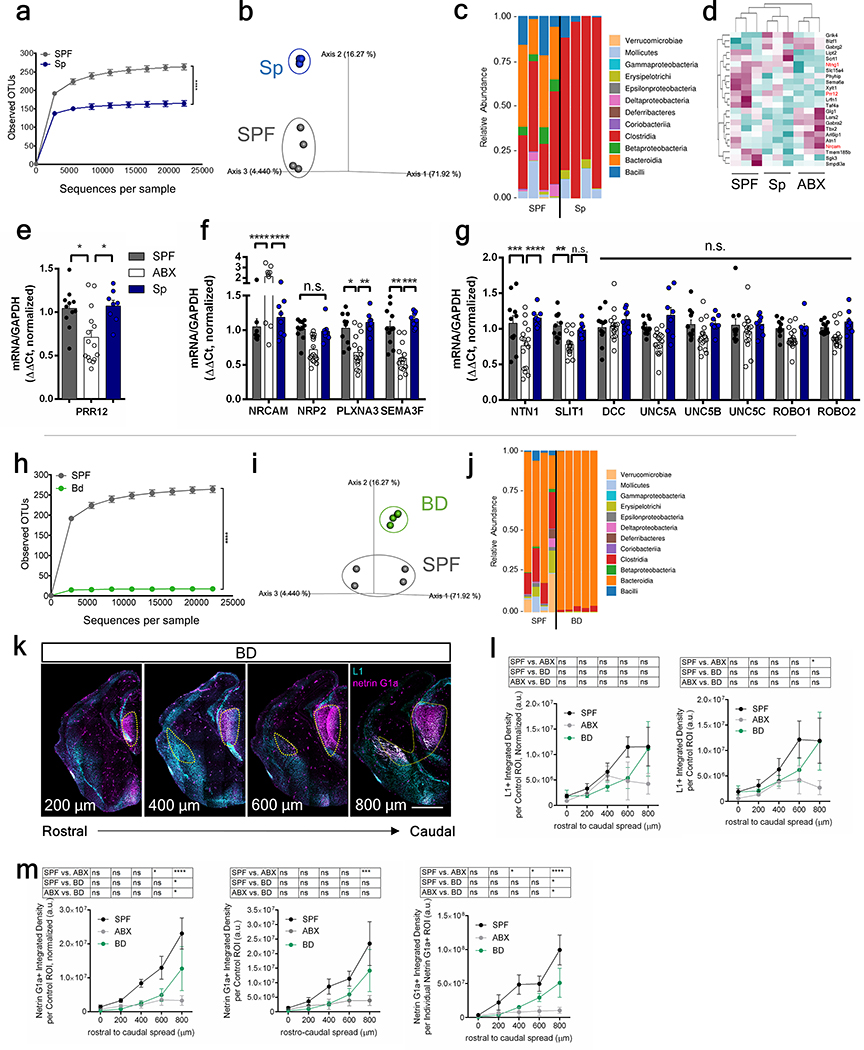
Extended Data Fig. 7|. Maternal gut microbiota and fetal thalamocortical axons in dams colonized with a consortium of spore-forming bacteria (Sp) or Bacteroides (BD).
Fecal microbiota of E14.5 SPF and Sp dams (n=4 dams): a, rarefaction curves of observed operational taxonomic units (OTUs). b, Principal coordinate analysis of weighted sequencing data, and c, order-level taxonomic diversity. d, Genes commonly differentially expressed in E14.5 brains from offspring of SPF and Sp vs. ABX dams (two-tailed Wald, n=3 dams). Data for SPF and ABX are as in Figure 1. Red indicates axonogenesis-related genes. e, PRR12 expression in E14.5 brains from offspring of SPF, ABX, and Sp dams (one-way ANOVA+Tukey’s; n = 11, 15, 8 offspring). f, g, Expression of axonogenesis-related genes in E14.5 brains from SPF, ABX, and Sp dams (Two-way ANOVA+Tukey’s; n=11, 16, 8 offspring). Fecal microbiota of E14.5 SPF and BD dams (n=4, 5 dams): h, rarefaction curves of the observed OTUs, i, principal coordinate analysis of weighted data, and j, order-level taxonomic diversity. k, Netrin-G1a (magenta) and L1 (cyan) in E14.5 brain sections of BD dams. Scale=500 μm. Yellow lines=matched control ROI. l, L1 per matched control ROI, un-normalized (right) and normalized (left) by total brain area of E14.5 brain sections of SPF, ABX, and BD dams. Data for SPF and ABX are as in Figures 1d and 2e, Extended Data Figure 3g–i. (Two-way ANOVA+Tukey’s, n=5 dams). m, Netrin-G1a per matched control ROI, un-normalized (middle) and normalized by total area of E14.5 brain sections (left). Netrin-G1a in area of Netrin-G1a+ staining in E14.5 brain sections (right). Data for SPF and ABX are as in Figures 1c and 2d, Extended Data Figure 2. (Two-way ANOVA+Tukey’s, n=5 dams). Mean±SEM. *p<0.05, **p<0.01, ***p<0.001, ****p<0.0001, n.s.=not statistically significant.

