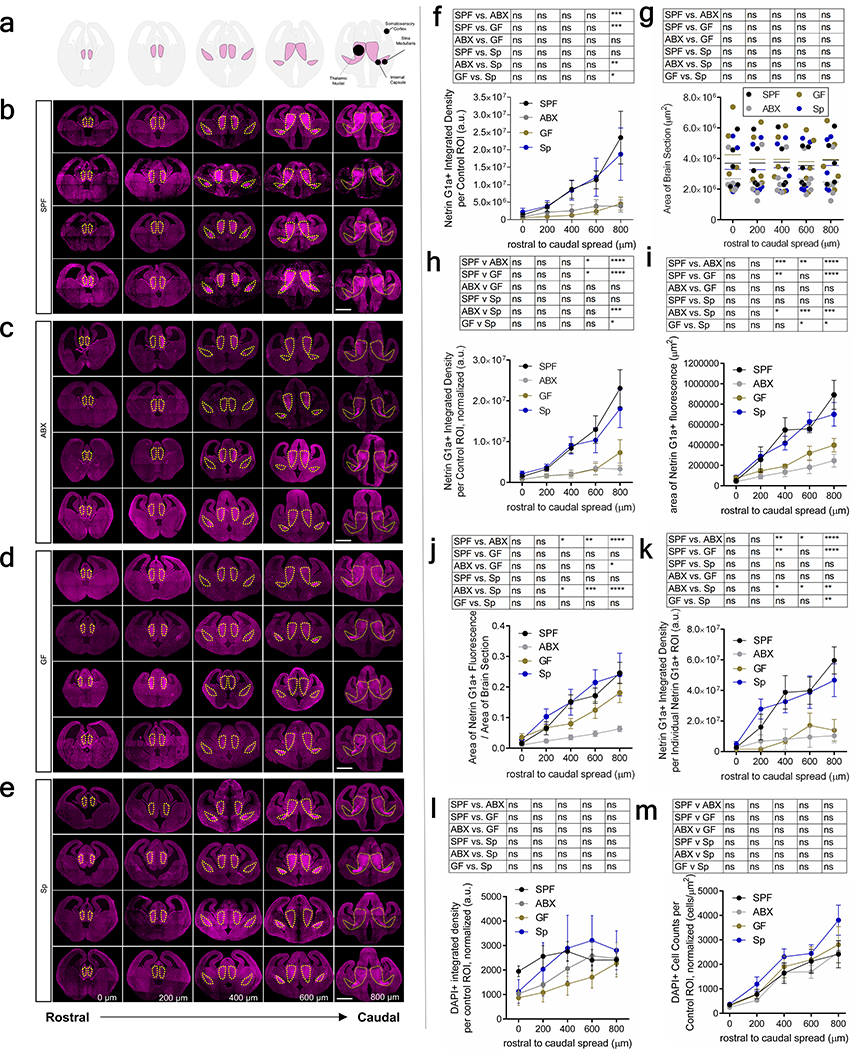
Extended Data Fig. 2|. Netrin-G1a thalamocortical axons in E14.5 brains of offspring from gnotobiotic dams.
a, Reference diagrams of coronal rostral to caudal E14.5 brain sections. b-e, Netrin-G1a in four independent E14.5 brains from offspring of SPF (b), ABX (c), GF (d), and Sp (e) dams. Scale=500 μm. Yellow lines= matched control ROI. f, Netrin-G1a fluorescence per control ROI in E14.5 brain sections of offspring from SPF, ABX, GF and Sp dams. SPF, ABX, GF and Sp data are as presented in Figure 1c and 3d. (Two-way ANOVA+Tukey’s, n=5 dams). g, Total brain area E14.5 brain section of offspring from SPF, ABX, GF and Sp dams. (Two-way ANOVA+Tukey’s, n=5 dams). h, Netrin-G1a per matched control ROI, normalized by total brain area in E14.5 brain sections of offspring from SPF, ABX, GF and Sp dams. (Two-way ANOVA+Tukey’s, n=5 dams). i, Area of Netrin-G1a in E14.5 brain sections of SPF, ABX, GF and Sp dams. (Two-way ANOVA+Tukey’s, n=5 dams). j, Area of Netrin-G1a+ staining normalized by total brain area in E14.5 brain sections of offspring from SPF, ABX, GF and Sp dams. (Two-way ANOVA+ Tukey’s, n=5 dams). k, Netrin-G1a fluorescence in area of Netrin-G1a+ staining of E14.5 brains from SPF, ABX, GF, and Sp dams. (Two-way ANOVA+Tukey’s, n=5 dams). l, DAPI per matched control ROI, normalized by total brain area in E14.5 brain sections from SPF, ABX, GF and Sp dams. (Two-way ANOVA+Tukey’s, n=5, 7, 4, 5 dams). m, DAPI+ cell per matched control ROI, normalized by total brain area in E14.5 brain sections from SPF, ABX, GF and Sp dams. (Two-way ANOVA+ Tukey’s, n=5, 7, 4, 5 dams). Mean±SEM. *p<0.05, **p<0.01, ***p<0.001, ****p<0.0001, n.s.=not statistically significant.

